Download
1 / 41
410 likes | 597 Views
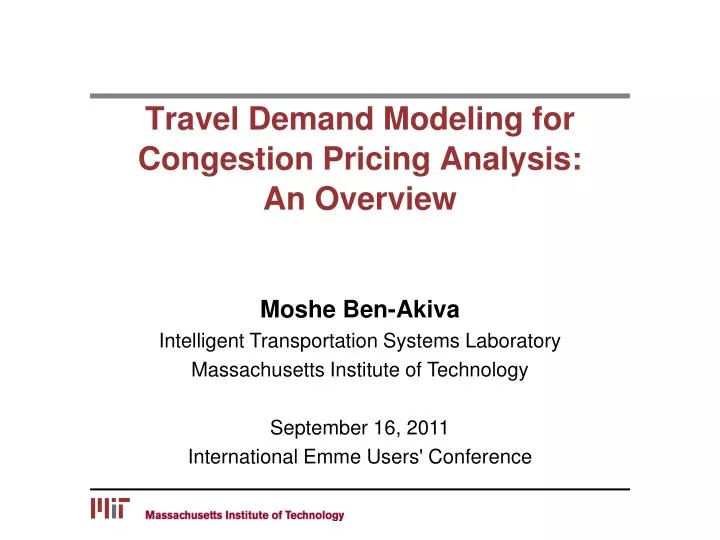
Travel Demand Modeling for Congestion Pricing Analysis: An Overview. Moshe Ben- Akiva Intelligent Transportation Systems Laboratory Massachusetts Institute of Technology September 16, 2011 International Emme Users' Conference. Outline. Motivation Activity schedule approach

E N D
Travel Demand Modeling for Congestion Pricing Analysis:An Overview Moshe Ben-Akiva Intelligent Transportation Systems Laboratory Massachusetts Institute of Technology September 16, 2011 International Emme Users' Conference
Outline Motivation Activity schedule approach Enhancements relevant to congestion pricing Value of time heterogeneity Travel time reliability Time-of-travel preferences Conclusion
Motivation Source: Bain, R. (2009) , “Error and optimism bias in toll road traffic forecasts,” Transportation, vol. 23, pp. 241-266
Motivation (2) Toll road traffic forecasts characterized by large errors and optimism bias Most of these forecasts are based on 4-step demand models Need for better demand forecasts that capture human decision-making in response to policies (e.g. tolls)
Long Term Choices (residential/workplace locations, auto ownership, lifestyle) Activity Pattern number/purpose/sequence of tours Primary Tours timing, destination Secondary Tours timing, destination Activity schedule approach (Ben-Akiva, Bowman & Gopinath1996)
Enhancements relevant to congestion pricing Value of time (VOT) heterogeneity Travel timereliability Time-of-travel preferences
VOT heterogeneity:Motivation • Variation in VOT affects all travel related decisions • Value of time (VOT) or willingness to pay for travel time savings varies by • Trip purpose • Travel mode • Trip length, income, etc. • But there also exists significant unexplained heterogeneity
VOT heterogeneity:Continuous logit mixture • ν = value of time • ci = travel cost of alternative i • ti = travel time of alternative i • Xi = vector of additional variables for alternative i • Zi = vector of additional variables for alternative i, whose coefficients vary proportionally to the time coefficient • εi = additive error term • μ = scale parameter • β,γ = unknown parameters Source: Ben-Akiva, M., Bolduc, D. and Bradley, M. (1993), “Estimation of travel choice models with randomly distributed value of time,” Transportation Research Record, vol. 1413, pp. 88-97.
VOT heterogeneity:Continuous logit mixture (2) Source: Ben-Akiva, M., Bolduc, D. and Bradley, M. (1993), “Estimation of travel choice models with randomly distributed value of time,” Transportation Research Record, vol. 1413, pp. 88-97. • Choice probability for a lognormal distribution of VOT • where are the parameters to be estimated simultaneously using maximum likelihood
VOT heterogeneity:Latent class Source:Gopinath, D. and Ben-Akiva, M. (1997), “Estimation of randomly distributed value of time,” Working paper, Department of Civil and Environmental Engineering, Massachusetts Institute of Technology Discrete distribution of value of time Segment population based on unobserved sensitivity through ordered levels Each individual belongs to exactly one class
VOT heterogeneity:Latent class (2) Source: 1. Gopinath, D. and Ben-Akiva, M. (1997), “Estimation of randomly distributed value of time,” Working paper, Department of Civil and Environmental Engineering, Massachusetts Institute of Technology. 2. Hess, S., Ben-Akiva, M., Gopinath, D. and Walker, J. (2009), “Advantages of latent class choice models over continuous mixed logit models,” presented at the 12th International conference on travel behavior research, Jaipur. • Class membership model : • Class-specific choice model: • Unconditional choice probability: • i= travel alternative • s = latent class • X = vector of alternative attributes and individual characteristics • θ,βs = vectors of unknown parameters
VOT heterogeneity:Hybrid with attitudinal indicators Attributes of Alternatives (X) Characteristics of the Traveler (X) Attitudes (A) Indicators (I) Utility (U) Interactions with cost and/or time Choice (i) Quantify latent attitudes and their effect on VOT using the hybrid choice model
VOT heterogeneity:Hybrid with attitudinal indicators (2) Model (Behavioral Mixture): Likelihood (choice & attitudinal Indicators):
VOT heterogeneity:Hybrid with attitudinal indicators (3) Source: Abou-Zeid, M., Ben-Akiva, M., Bierlaire, M., Choudhury, C. and Hess, S. (2010). “Attitudes and value of time heterogeneity” in Applied Transport Economics: A Management and Policy Perspective. eds. E. Van de Voorde, T. Vanelslander. Uitgeverij De Boecknv, Antwerp, Belgium, pp. 523-545. • 2005 survey in Stockholm, N= 2400 • Choice (SP): car vs public transportation • Questions indicating car-loving attitude: • I1: It is comfortable to go by car to work. • I2: It feels safe to go by car • I3: It is very important that traffic speed limits are not violated • I4: Increase the motorway speed limit to 140 km/h
VOT heterogeneity:Hybrid with attitudinal indicators (4) 7,500 < Income < 15000 25,000 < Income < 30,000 Income >50,000 Base model Model with latent attitudes Source: Abou-Zeid, M., Ben-Akiva, M., Bierlaire, M., Choudhury, C. and Hess, S. (2010). “Attitudes and value of time heterogeneity” in Applied Transport Economics: A Management and Policy Perspective. eds. E. Van de Voorde, T. Vanelslander. Uitgeverij De Boecknv, Antwerp, Belgium, pp. 523-545. CDF of VOT by Income (SEK/hour) group
VOT heterogeneity:Conclusion • Considerable heterogeneity in Value of Time • Methods based on Logit mixtures: • Continuous mixture (aka Mixed Logit) • Latent class (discrete mixture) performs better as the mixing distribution includes covariates and introduces correlations • Hybrid with attitudinal indicators enhances the power of mixture models
Travel time reliability: Expected utility (EU) methods • Conventional approach: risk attribute • Mean / variance of travel time • Mean schedule delay
Travel time reliability: Non-expected utility methods • Delays with probability near 0 or 1 are not well-perceived (Avineri and Prashker 2004) • Overweigh small probabilities • Underweigh large probabilities • Methods: • Rank-dependent (RDEU) • Cumulative prospect theory (CPT) (Gao et al 2010) • Latent-class model of risk seeking heterogeneity (Razo and Gao 2010)
Travel time reliability: CPT vs. EU performance (Gao et al. 2010) • Synthetic data • Lowest travel time chosen as reference • Delays are considered losses • CPT is applied only in loss domain Source: Gao, S., Frejinger, E. and Ben-Akiva, M. (2010). “Adaptive route choices in risky traffic networks: A prospect theory approach”. Transportation Research Part C: Emerging Technologies vol. 18, no. 5, pp. 727-740.
Travel time reliability: CPT vs. EU performance (2) Highway Local Street Source: Gao, S., Frejinger, E. and Ben-Akiva, M. (2010). “Adaptive route choices in risky traffic networks: A prospect theory approach”. Transportation Research Part C: Emerging Technologies vol. 18, no. 5, pp. 727-740.
Time-of-travelpreferences: Motivation Time-of-travel choice is highly elastic with respect to congestion pricing
Time-of-travelpreferences: Schedule delay Difference between desired and actual time-of-travel due to congestion, reliability, and non-continuous public transportation schedules Key explanatory variable of time-of-travel choice Travelers trade off schedule and congestion delays
SD(t,t*) t t* Time-of-travelpreferences: Schedule delay disutility • t = time-of-travel • t*= desired time-of-travel • TT(t)= travel time at t • α(t) = ASC for time-of-travel t • SDearly(t,t*) = early schedule delay for time-of-travel t • SDlate(t,t*) = late schedule delay for time-of-travel t
Time-of-travelpreferences: Schedule Delay When Desired Departure or Arrival Times Are Unknown • Assume t* is (unknown) constant for individualsin a market segment • Schedule delay functions become arrival and departure time preference functions by market segment
Time-of-travelpreferences: The 24 hour cycle Need cyclic functions: V(0) = V(24) Trigonometric Function - based on the idea of Fourier series Truncation at K is determined empirically
Time-of-travelpreferences: Illustration of Trigonometric Function Source: Ben-Akiva, M. and Abou-Zeid, M. (2007) “Methodological issues in modeling time-of-travel preferences”, in 11th World Conference on Transport Research, Berkeley, CA.
Conclusion Activity-based demand models Enhancements relevant to congestion pricing Value of time heterogeneity Travel time reliability Time-of-travel preferences
4-step demand models • Classic 4-step (trip based) • Trip Generation (Frequency) • Trip Distribution (Destination) • Modal Split (Mode) • Assignment (Route) • Congestion pricing affecting the AM trip to work also affects other trips in the day
Representing activity/travel behavior Source: Ben-Akiva, M. and Bowman, J. (1998), “Activity based travel demand model systems,” in Equilibrium and Advanced Transportation Modeling, eds. P. Marcotteand S. Nguyen, Kluwer Academic Publishers.
Activity-based demand models Land-use and Economic Development Mobility and Lifestyle Activity and Travel Scheduling Activity and Travel Rescheduling Tour Type Duration Departure Time Activity Sequence Path Destination Transportation System Performance Source: Ben-Akiva, M., Bowman, J. and Gopinath, D. (1996), “Travel demand model system for the information era,” Transportation, vol. 23, pp. 241-266.
Travel time reliability: Motivation Source: US DOT FHA, Travel Time Reliability, 2006, http://ops.fhwa.dot.gov/publications/tt_reliability/
Travel time reliability: Motivation (2) Source: Li, Z., Hensher, D. and Rose, J. (2010). “Willingness to pay for travel time reliability in passenger transport: A review and some new empirical evidence”. Transportation Research Part E: Logistics and Transportation Review, vol.46, no. 3, pp. 384-403 • Travel time reliability accounts for 5-35% of trunk road scheme economic benefits (SACTRA 1999) • Scheduling delay accounts for 30-40% of total time cost (Ettema and Timmermans 2006) • Ratio of reliability estimated to be > 1 • Commuter car travel: 1.3 (Bates et al. 2003) • Public transit: 1.4 (de Jong et al. 2009)
Travel time reliability: Latent-class Logit model (Razo and Gao 2011) I-93 Rt.2 I-90 Source: Razo, M. and Gao. S. (2010). A Rank-Dependent Expected Utility Model for Strategic Route Choice with Stated Preference Data: 1-27. http://www.ecs.umass.edu/~songgao/NewPaperv13.pdf. • PC-based experiment • Accounts for both strategic and non-strategic behavior • Estimates overall probability that an observation is the result of strategic choice behavior • Choice set at the origin with two alternatives • {safe (I-93), risky route (I-90)} if non-strategic • {safe (I-93), risky branch (I-90 and Rt.2)} if strategic
Travel time reliability: Latent-class Logit model (2) Source: Razo, M. and Gao. S. (2010). A Rank-Dependent Expected Utility Model for Strategic Route Choice with Stated Preference Data: 1-27. http://www.ecs.umass.edu/~songgao/NewPaperv13.pdf. • Latent-class logit mixture model form: choice: observed choice at the origin (safe or risky) • Systematic utility of the risky branch (Vrisky) in the strategy map • Large delay not included if strategic • Large delay included if non-strategic
Travel time reliability: Latent-class Logit model (3) Source: Razo, M. and Gao. S. (2010). A Rank-Dependent Expected Utility Model for Strategic Route Choice with Stated Preference Data: 1-27. http://www.ecs.umass.edu/~songgao/NewPaperv13.pdf. Estimated strategic class probability (0.880-0.934) is significantly different from 0 and 1 The same individual exhibits strategic and non-strategic route choice behavior depending on the situation Probability weighing function has a pronounced inverse S-shape
Time-of-travel choice: Continuous Logit (CL) • t is the continuous time-of-travel variable, bound by b1and b2(e.g. 0, 24h) Source: Ben-Akiva, M. and Watanatada, T. (1981) “Application of a continuous spatial choice logit model”. in Structural Analysis of Discrete Data with Economic Applications. eds. C.F. Manski, D. McFadden, MIT Press, Cambridge, pp. 320-343
Time-of-travel choice: Continuous cross-nested logit (CCNL) (Lemp et al. 2010) Source: Lemp, J., Kockelman, K. and Damien, P. (2010). “The continuous cross-nested logit model: Formulation and application for departure time choice”, Transportation Research Part B: Methodological , vol. 44, no. 5, pp. 646-661. • Cross-nested formulation to handle correlation between adjacent time periods • Each nest contains a set of sequential elemental alternatives
Time-of-travel choice: CCNL (2) Nests are centered at w with an interval 2h contains alternatives w-h to w+h , α(t,w) is the allocation parameter of alternative t to nest w Scale parameter: Assumes similar correlation structure across the day Source: Lemp, J. , Kockelman, K. and Damien, P. (2010). “The continuous cross-nested logit model: Formulation and application for departure time choice,” Transportation Research Part B: Methodological , vol. 44, no. 5, pp. 646-661.
Time-of-travel choice: CCNL (3) Source: Lemp, J. , Kockelman, K. and Damien, P. (2010). “The continuous cross-nested logit model: Formulation and application for departure time choice”, Transportation Research Part B: Methodological , vol. 44, no. 5, pp. 646-661.
Travel Demand Modeling for Congestion Pricing Analysis:An Overview Moshe Ben-Akiva Intelligent Transportation Systems Laboratory Massachusetts Institute of Technology September 2011 International Emme Users' Conference