Download
1 / 1
10 likes | 101 Views
Table 2: Cost Components of each Service (% of total cost) . Table 1: Description of Pharmacy Services . Discussion/Conclusion Most of the pharmacist services had an annual net gain during the study period and it seems likely that these services can be sustained in the future

E N D
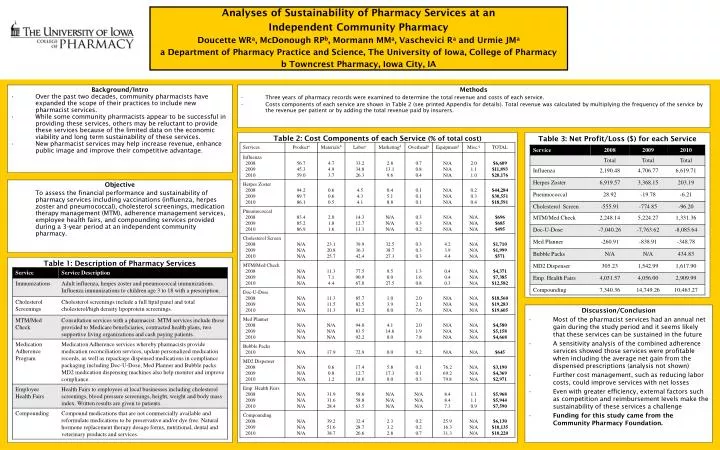
Table 2: Cost Components of each Service (% of total cost) Table 1: Description of Pharmacy Services Discussion/Conclusion Most of the pharmacist services had an annual net gain during the study period and it seems likely that these services can be sustained in the future A sensitivity analysis of the combined adherence services showed those services were profitable when including the average net gain from the dispensed prescriptions (analysis not shown) Further cost management, such as reducing labor costs, could improve services with net losses Even with greater efficiency, external factors such as competition and reimbursement levels make the sustainability of these services a challenge Funding for this study came from the Community Pharmacy Foundation. Table 3: Net Profit/Loss ($) for each Service Methods Three years of pharmacy records were examined to determine the total revenue and costs of each service. Costs components of each service are shown in Table 2 (see printed Appendix for details). Total revenue was calculated by multiplying the frequency of the service by the revenue per patient or by adding the total revenue paid by insurers. Objective To assess the financial performance and sustainability of pharmacy services including vaccinations (influenza, herpes zoster and pneumococcal), cholesterol screenings, medication therapy management (MTM), adherence management services, employee health fairs, and compounding services provided during a 3-year period at an independent community pharmacy. Background/Intro Over the past two decades, community pharmacists have expanded the scope of their practices to include new pharmacist services. While some community pharmacists appear to be successful in providing these services, others may be reluctant to provide these services because of the limited data on the economic viability and long term sustainability of these services. New pharmacist services may help increase revenue, enhance public image and improve their competitive advantage. Analyses of Sustainability of Pharmacy Services at an Independent Community Pharmacy Doucette WRa, McDonough RPb, Mormann MMa, Vaschevici Ra and Urmie JMa a Department of Pharmacy Practice and Science, The University of Iowa, College of Pharmacy b Towncrest Pharmacy, Iowa City, IA