Download
1 / 19
190 likes | 330 Views
CMB B-modes: Foregrounds. Paddy Leahy, Clive Dickinson, Mike Preece, Mike Peel (Manchester). rms Q,U @ 1 ° E B, r = 0.1 3.4% anomalous dust 10% thermal dust. Polarized Foregrounds. QUIJOTE. FG separation strategy. Adjacent bands give little leverage on spectral parameters

E N D
CMB B-modes: Foregrounds Paddy Leahy, Clive Dickinson, Mike Preece, Mike Peel (Manchester) Cambridge CMB meeting 20th July 2009
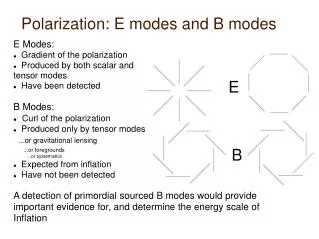
rms Q,U @ 1° E B, r=0.1 3.4% anomalous dust 10% thermal dust Polarized Foregrounds QUIJOTE Cambridge CMB meeting 20th July 2009
FG separation strategy • Adjacent bands give little leverage on spectral parameters • No point in having bands too close together • Widely separated bands susceptible to subtle departures from simple spectral models (power law) • No point in having bands too far from CMB minimum • If only the CMB had a spectral “feature”! Cambridge CMB meeting 20th July 2009
Synchrotron spectral are smooth! • Power law is just an approximation… • …but a good one • The best-measured synchrotron sources are well fit by a 2nd-order log-log polynomial over 2 decades of frequency Cambridge CMB meeting 20th July 2009
CR energy spectra well known to be smooth over many orders of magnitude… … but dominated by baryons. What about the electrons & positrons that produce the synchrotron radiation? Cosmic ray spectrum Simpson (ARNPS 1983) Cambridge CMB meeting 20th July 2009
100 20 5 350 GHz Fermi electron spectrum (B sinθ = 2.5 µG) Cambridge CMB meeting 20th July 2009
Fermi e−/e+ results • Apparent curvature in spectrum suggests new feature @ E > 100 GeV, perhaps related to increasing positron fraction in PAMELA data • But with current calibration, data consistent with pure power law, p=−3.04 (i.e. β=−3.02) • Synchrotron emitted in CMB band (<300GHz) dominated by E < 100 GHz. • TBD: assess impact of apparent curvature. Cambridge CMB meeting 20th July 2009
Synchrotron polarization varies with frequency for curved spectra (as expected in the Galaxy). Detail of variation depends on B-field geometry, dependence of electron energy on pitch angle. Diagnostic of scattering efficiency. Degree of polarization vs. scaled frequency for “single burst” spectral ageing model (Leahy, Black & Chan in prep.) Synchrotron Polarization Cambridge CMB meeting 20th July 2009
Spectral Index 21:1.3 cm Cambridge CMB meeting 20th July 2009
Minimum polarized intensity coincides with minimum 408 MHz intensity Typical fractional polarization at high latitude outside loop ≈ 10% = 75%/√N Unless strongly contaminated…free-free? anomalous dust? N ~ 50: much line-of-sight structure in field direction, even straight up out of plane. If angle can vary on LOS, so can spectral index. Fractional Polarization Cambridge CMB meeting 20th July 2009 Kogut et al (2007)
Loop I / North Polar Spur 2° smoothing WMAP Haslam map Cambridge CMB meeting 20th July 2009
North polar spur supposed to be at ~140pc. Synchrotron scale height ~ 1 kpc Projected B-field angle the same in spur and in “diffuse” emission outside it!!? Local & Distant B-fields Cambridge CMB meeting 20th July 2009
#7: “Physical” model: silicate grains, emissivity α= 1.5, T = 9.6 K carbon (?) grains, α = 2.6, T = 16.4 K α from lab measurements, T from fit to FIRAS data. #8: “Free-fit” model: Emissivity indices allowed to float: α = 1.67, 2.70; T = 9.4, 16.2 K Reduced χ2: 2.031.85 Fits exclude |b| < 7° Good evidence that cold component more dominant in HI vs H2 clouds (NB composition not Tdust!) Composition or emission/abs properties 15% effect; not included in released FDS models. FDS #7 & #8: good fits to WMAP 94 GHz dust outside mask Model underpredicts by 26% (Gold et al) or 15% (my analysis). Grotesquely over-simplified? Finkbeiner Davis & Schlegel (1999) Cambridge CMB meeting 20th July 2009
Point sources 97 GHz 30 GHz r = 0.1 r = 0.01 r = 0.001 Toffolatti et al. (1998), Scuba IR counts (1% pol) All > 1 Jy 150 GHz 220 GHz > 0.1 Jy > 0.01 Jy Cambridge CMB meeting 20th July 2009
State of the art • CMBPol foreground subtraction report • (Dunkley et al. 2008. arXiv:0811.3915): • We got away with it for the FIR Background • We have codes ready to run to do B-mode foreground separation. e.g: • Codes that assume spectrum of each component is uniform over the sky (ILC, ICA) • Codes that assume each foreground component has simple spectrum (e.g. power law) (FGFit/Miramare) • These assumptions known to be wrong: • How wrong? • How much difference does it make? • Simulations in progress… Cambridge CMB meeting 20th July 2009
Update to CMBPol report Now with latest dust polarization level: Gives 5% at high latitude after geometric effects. PSM Models Cambridge CMB meeting 20th July 2009
Summary • Next 3 years should define problem • Planck HFI on thermal dust spectrum & polarization (not to mention BICEP) • Fermi + AMS on cosmic ray electron/positron primaries. • What to minimise… • Sensitivity? • Observe 60-150 GHz • Foreground uncertainty? • Observe 200-350 GHz Cambridge CMB meeting 20th July 2009
Faraday Rotation Cambridge CMB meeting 20th July 2009
Away from Galactic plane, RMS Faraday rotation between λ1.3 cm and λ21cm is 33° < 3° at 6 cm < 0.2° at 1.3 cm Significantly less than Faraday rotation of extragalactic sources Diffuse synchrotron emission is mixed with ionized layer. PA differences between WMAP bands (22.5 – 33 GHz) suggest large Faraday rotation near Galactic Centre: 3°-4° at 1.3 cm, RM ≈−700 rad m-2 A few pixels show up to 22° rotation between 22.5-33 GHz Random errors (~ 5σ, but non-Gaussian) Change of emission mechanism (dust polarization?) Very large RM?? Faraday Rotation Cambridge CMB meeting 20th July 2009