Download
1 / 11
110 likes | 257 Views
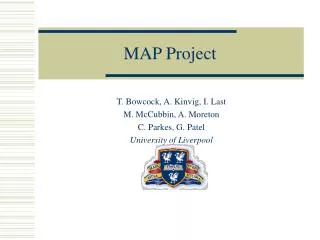
Industrial Project Check Point Security Map. Shiri Negrin and Katya Sapozhnikov. Agenda. Team Goals Methodology Achievements Examples Conclusions. Team. Students: Shiri Negrin and Katya Sapozhnikov Computer science 3 rd year student Supervisor: Yevgeny Fabrikant Checkpoint.

E N D
Industrial ProjectCheck PointSecurity Map Shiri Negrin and Katya Sapozhnikov
Agenda • Team • Goals • Methodology • Achievements • Examples • Conclusions
Team Students: ShiriNegrin and Katya Sapozhnikov Computer science 3rd year student Supervisor: Yevgeny Fabrikant Checkpoint
Goals • Converting network communication log and network DB file to graphical display of the network structure
Methodology • Built parser for network log file (csv) • Built parser for network DB file (fwset) • Created DB of assets divided by subnets • Applied relationship between subnets according to network log file • Created graph files (graphml, gml) using igraph library for the network and each subnets separately • Created configuration for yEd graph editor for project use • Visualized graph using yEd graph editor
Achievements • Built parsers for both input files (csv log file, fwset DB file) • Created DB that contains inner network subnets and their relationship • Created representation of the network DB using a graph • Visualized network structure graph
DB • file
Conclusions • Work division • Focus on small tasks • Extensive work plan • Time management