Download
1 / 67
670 likes | 796 Views
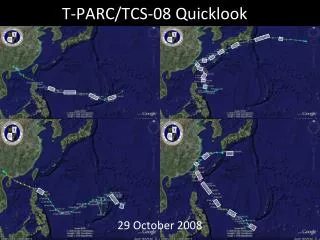
Update on P3DWL data and TCS-08 associated research. G. D. Emmitt Simpson Weather Associates Ralph Foster University of Washington October 28 2009. Outline. Data processing and access to P3DWL products Ongoing research using P3DWL data Examples of P3DWL data products and analyses (Emmitt)

E N D
Update on P3DWL data and TCS-08 associated research G. D. Emmitt Simpson Weather Associates Ralph Foster University of Washington October 28 2009
Outline • Data processing and access to P3DWL products • Ongoing research using P3DWL data • Examples of P3DWL data products and analyses (Emmitt) • Case study (Foster) Airborne DWL and Emmitt/Foster research funded by Dr. Ronald Ferek, ONR
P3DWL for TPARC/TCS-08 1.6 um coherent WTX (ARL/LMCT) 10 cm bi-axis scanner (NASA) P3 and other parts (NRL) Analyses software (SWA/CIRPAS)
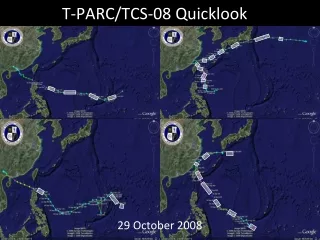
Activity Summary • P3DWL in the field from August 4 to October 8, 2008 • Total data (ground and airborne) = 171 hours • Flew 18 missions with Tropical Cyclones as target • 118 hours of data • Additional flights: • Calibration of other instruments • Ferry flights between bases • Ferry flights USA – Guam – USA (> 20000 km)
Access to P3DWL data (1) • First time data product from a first time instrument • Early data products revealed mostly good results and comparisons with dropsondes and flight level observations. • Measurements to the surface from 3km much more numerous than expected for Typhoon environments (82%)
Access to P3DWL data(2) • All data processed. More than 3000 files holding > 20000 profiles • Data sets for Nuri, Sinlaku and Hagupit already provided to several users • However: • Still finding cases where we suspect the data since it does not conform to our expectations; if real, then very interesting. • We use high threshold quality filters for data sent out; still very useful data held back but could be provided depending upon user’s intended use.
Access to P3DWL data (3) • SWA is archiving all data. • Raw data has been copied 4 times and stored in three differing locations and on three different media. • SWA will reprocess and review upon demand data requested. We will also consult with the user about any issues related to the use and interpretation of the data.
Access to P3DWL data (4) • Contact and data access information: • Steven Greco • 434-979-3571 • sxg@swa.com • FTP site • ftp.swa.com • Login: swaguest • Password: wind • cd publicsite/P3DWL_DATA_PUBLIC
Current research using P3DWL data • ZhaoxiaPu (University of Utah) • Nuri • Sinlaku • Hagupit • Foster (University of Washington) • Hagupit • Emmitt (Simpson Weather Associates) • Dropsonde comparisons • Layer Adjacent to the Surface (LAS) investigations
Impact of Airborne Doppler Wind Lidar Profiles on Numerical Simulation of Tropical cyclones: First snapshot with Typhoon Nuri (2008) Zhaoxia Pu and Lei Zhang, Department of Atmospheric Sciences, University of Utah G. David Emmitt, Simpson Weather Associates, Inc. Model: Mesoscale community Weather Research and Forecasting (WRF) model Data: Doppler wind Lidar (DWL) profiles during T-PARC for the period of 0000UTC –0200 UTC 17 August 2008 Forecast Period: 48-h forecast from 0000UTC 17 August 2008 to 0000UTC 19 August 2008 Control: without DWL data assimilated into the WRF model. Data Assimilation: With DWL data assimilated into the WRF model Data impact: Control vs. Data assimilation • Assimilation of DWL profiles eliminated • the northern bias of the simulated storm • track . • Assimilation of DWL profiles resulted in a stronger storm that is more close to the observed intensity of the storm.
Focus on Layer Adjacent to the Surface (LAS) • Potential information from DWL • Wind speed (removing surface contribution) • Wave motion(wave lengths) • Presence of foam • Presence of sprays • TKE
What we have to work with • 50 meter range resolution (Gausian pulse ~ 70 meters FWHM) • 10 cm beam diameter • Spectral domain • Frequency • Spectral feature width • Frequency discrimination of multiple LOS motions
Processing tools • Threading • Sliding range gates • Movies (contextual) • Filtering
LAS Water Spectrum for range gate 20 associated with data taken at 33 degrees off nadir. The data has not been fully corrected for the aircraft forward motion
Monitor Pulse Amplitude Versus Frequency Amplitude: Black Dots Frequency: Open Squares
DWL over land Video
Hagupit • P-3: 2008-09-22 00:21 to 05:05 • 29 drop Sondes (2 bad) • ~134 lidar VADs (some residual data issues) • Eldora backscatter imagery from TCS-08 website • Lidar Winds • Data lag into Lidar processor, wrong pointing information • Mainly affects later VADs in a sequence (file) • 1st guess ~34 VADs affected • Approximate rotation into Radial, Tangential winds using JTWC best track • Issues with Urad: TC center? TC translation Vel? Cloud inflow? Lidar processing issue? • Same rotation on Sondes “looks” better • Some good and bad examples
VAD locations: circles Sonde Drops: squares Approx. TC center from JTWC best track at different times