Download
1 / 1
10 likes | 138 Views
Light intensity (µmol m -2 s -1 ). 1000. 0. AA. - +. wt. pgr5. - +. A. 3.0. AA. 2.5. - +. wt. - +. pgr5. 2.0. NPQ. 1.5. 1.0. 0.5. 0.0. 0. 5. 10. 15. 20. 25. Duration of incubation (min). B. 0.9. Control (-Cm). +Cm. 0.8. 0.7. 0.6. 0.5. F v / F m. 0.4. 0.3.

E N D
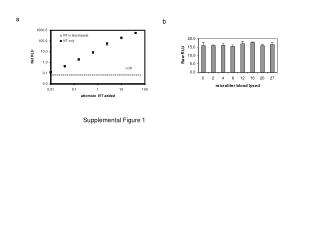
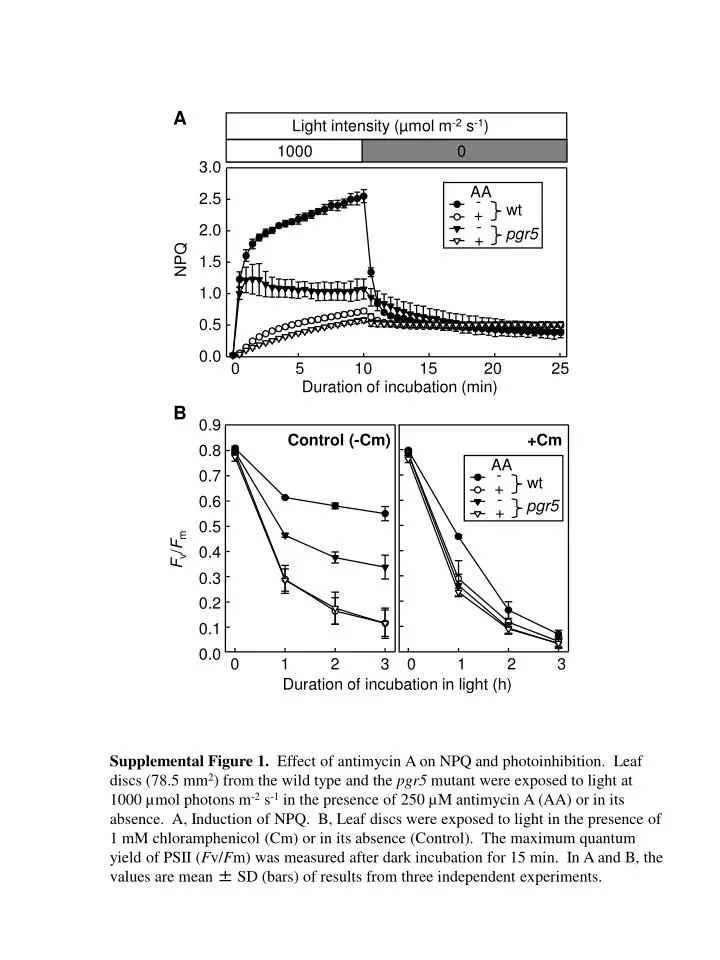
Light intensity (µmol m-2 s-1) 1000 0 AA - + wt pgr5 - + A 3.0 AA 2.5 - + wt - + pgr5 2.0 NPQ 1.5 1.0 0.5 0.0 0 5 10 15 20 25 Duration of incubation (min) B 0.9 Control (-Cm) +Cm 0.8 0.7 0.6 0.5 Fv/Fm 0.4 0.3 0.2 0.1 0.0 0 1 2 3 0 1 2 3 Duration of incubation in light (h) Supplemental Figure 1. Effect of antimycin A on NPQ and photoinhibition. Leaf discs (78.5 mm2) from the wild type and the pgr5 mutant were exposed to light at 1000 µmol photons m-2 s-1 in the presence of 250 µM antimycin A (AA) or in its absence. A, Induction of NPQ. B, Leaf discs were exposed to light in the presence of 1 mM chloramphenicol (Cm) or in its absence (Control). The maximum quantum yield of PSII (Fv/Fm) was measured after dark incubation for 15 min. In A and B, the values are mean ± SD (bars) of results from three independent experiments.