Download
1 / 29
320 likes | 697 Views
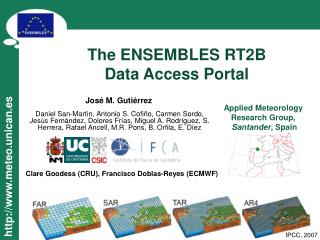
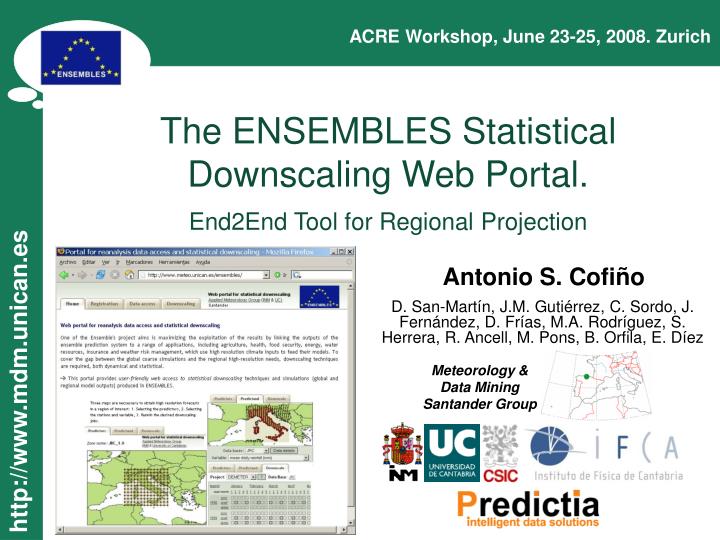
ACRE Workshop, June 23-25, 2008. Zurich. The ENSEMBLES Statistical Downscaling Web Portal. End2End Tool for Regional Projection. Antonio S. Cofiño. D. San-Martín, J.M. Gutiérrez, C. Sordo, J. Fernández, D. Frías, M.A. Rodríguez, S. Herrera, R. Ancell, M. Pons, B. Orfila, E. Díez.

E N D
ACRE Workshop, June 23-25, 2008. Zurich The ENSEMBLES Statistical Downscaling Web Portal. End2End Tool for Regional Projection Antonio S. Cofiño D. San-Martín, J.M. Gutiérrez, C. Sordo, J. Fernández, D. Frías, M.A. Rodríguez, S. Herrera, R. Ancell, M. Pons, B. Orfila, E. Díez Meteorology & Data Mining Santander Group
Motivation However, it is still difficult for end-users to access the stored simulations and to post-process them to be suitable for their own models: daily resolution, interpolation to prescribed locations, etc. There is a need of friendly interactivetools so users can easily run interpolation/downscaling jobs on their own data usingthe existing downscaling techniques and simulation datasets (AR4, Prudence, ENSEMBLES, ...). There are many projects around the world producing global (GCM) and regional (RCM) simulations of climate change. Many of these projects involve end-uses from impact sectors ...
Statistical Downscaling (SD). WHY? Typical resolution of climate change GCMs. Typical resolution of Seasonal GCMs. There is a gapbetween the coarse-resolution outputs available from GCMs and the regional needs of the end-users. Surface variables: • Mean precipitation • Precip. 90th percentile • Consecutive dry days • Number of heavy events ECHAM5/MPI-OM (200 km) Even if they work at seasonal or climate change scales, end-users normally need daily values interpolated (downscaled) to the local points or grids of interest.
Statistical Downscaling (SD). HOW? RCM Dynamical Downscaling runs regional climate models in reduced domains with boundary conditions given by the GCMs. B2 A2 Historical Records A2 Climatology (1961-90) Y = f (X;) The form and parameters of the model depend of the different tecniques used. A2 Statistical Downscaling is based on empirical models fitted to data using historical records. Emission Scenarios GCM Global Predictions
SD. Transfer Functions Linear Regression: TMaxn = a+bT850n Neural Networks: TMaxn = f (T850n), Neural Net. Local Records of Tmax Linear model Neural networks are non-parametric models inspired in the brain. 850mb GCM outputs (closest grid point) Precipitaion, temperatures, etc. (T(1ooo mb),..., T(500 mb); Z(1ooo mb),..., Z(500 mb); .......; H(1ooo mb),..., H(500 mb)) = Xn Yn
SD. Weather Types (e.g. analogs) Analog set PC2 PC1 Weather Type (cluster) frequency mean Pforecast (precip > u) = SCk P(precip > u | Ck) Pforecast(Ck)
Skill of Statistical Downscaling The variability of the results obtained using different types of downscaling models in some studies suggests the convenience of using as much statistical downscaling methods as possible when developing climate-change projections at the local scale. For some indices and seasons, the spread is very small (e.g. pav in JJA) but for others it is much larger (e.g. pnl90 in DJF). Importantly, for each index the variability among models is of the same order of magnitude as the variability between the two scenarios. DOWNSCALING HEAVY PRECIPITATION OVER THE UNITED KINGDOM: A COMPARISON OF DYNAMICAL AND STATISTICAL METHODS AND THEIR FUTURE SCENARIOS (HAYLOCK ET AL. 2006)
www.meteo.unican.es/ensembles 30 users from 20 partners
Data Availability. Observations • ECA (European Climate Assessment & Dataset project). Daily datasets ofprecipitation, temperature, pressure, humidity, cloud cover, sunshine and snowdepth since 1900 over networks of 100-1000 stations. • Ensembles 50km gridded daily observation records of precipitation and surfacetemperature. 1950-2006.
Data Availability. Reanalysis & S2D Data available for the European region: •NCEP/NCAR Reanalysis1. 1948-2007 • ERA40 ECMWF: 1957-2002 • JRA25 Japanese Reanalysis: 1979-2004 A smaller worldwide dataset is also available Available for Europe • DEMETER. Multi-model seasonal prediction experiment including seven models ran for six months four times a year using 9 different perturbed initial conditions (9 members). • ENSEMBLES Stream 1. Check the help in the portal for updated information about this dataset.
Data Availability. ACC Daily worldwide datasets obtained from different sources: • CERA • IPCC data centre (PCMDI) • Local Providers. • PCMDI_CGCM3. Canadian Centre for Climate Modelling and Analysis, including 20th century (from 1951 to2000) and scenarios A1B, B1 (periods 2046-2065 and 2081-2100). • • CERA_MPI-ECHAM5, including 20th century data (1961-2000) and scenariosA1B, B1, and A2 (2001-2100). • CNRM-CM3 (local provider), including 20th century (1961-2000) and scenarios A1B, B1, andA2 (2001-2100). We will continue including datasets as they become available.
Data Access Portal 60,Potential Vorticity,PV 129,Geopotential,Z 130,Temperature,T 131,U velocity,U 132,V velocity,V 133,Specific humidity,Q 136,Total Column Water,TCW 137,Total Column Water Vapour,TCWV 138,Relative vorticity,VO 142,Large Scale Precipitation,LSP 143,Convective Precipitation,CP 151,MSLP,MSL 155,Divergence,D 157,Relative humidity,R 165,10m E-Wind Component,10U 166,10m N-Wind Component,10V 167,2m Temperature,2T 168,2m Dew Point,2D 1000, 925, 850, 700, 500, 300 mb 00, 06, 12, 18 , 24 UTC 1.125ºx1.125º resolution
Statistical Downscaling Portal Predictors Downscaling Model Predictands (T(1ooo mb),..., T(500 mb); Z(1ooo mb),..., Z(500 mb);H(1ooo mb),..., H(500 mb))Xn PrecipitationTemperature Regres, CCA, … Yn = WTXn Yn Regional zone Local zone This is the structure followed in the portal’s design: predictors + predictand + downscaling method. Problem: Local climate change prediction for Madrid (Spain): maximum temperature Goal: Provide daily local values for the summer season june-august 2010-2040 in a suitable format (e.g., text file, or Excel file).
Demo... My Home The “My Home” tab allows the user to explore: • The zones (pre-defined regions). • The profile with the account information. • The status of the jobs: queued, running, finished.
Demo... Predictors A simple zone with a single predictor parameter: T850mb was created. New zones can be easily defined by clicking in the “new zone” button.
Demo...Time to Compute Scheduling the job Five minutes later ...
Climate Change Scenarios Max. Temp
Seasonal validation (RSA) Precip Tmax
... windows of opportunity with ENSO Teleconnections with ENSO may bring some seasonal predictability to the extra-tropics and, thus, some window of opportunity for operational seasonal forecast.
Current Status • Support for users in ENSEMBLES project. • Data access for Reanalysis, Seasonal2Decadal and Climate Change models. • Users can use common observations datasets or upload their own data for downscaling. • Data access control based on user authentication and authorization. • User can choose predictors, predictands and transfer function to be used in the downscaling process. • Quality assessment of the downscaling. • Download the downscaled data.
Future actions • Start to open the tool to wider community outside ENSEMBLES project and Europe. • Data access and storage: towards remote accessing of datasets based on OPeNDAP. Reanalysis, S2D & ACC simulations. • Incorporate more statistical downscaling tools. • Ongoing work on geographically distributed computing and storage based on GRID technologies (EGEE, EELA,…). Thank you !!! http://www.mdm.unican.es antonio.cofino@unican.es