Download
1 / 17
170 likes | 308 Views
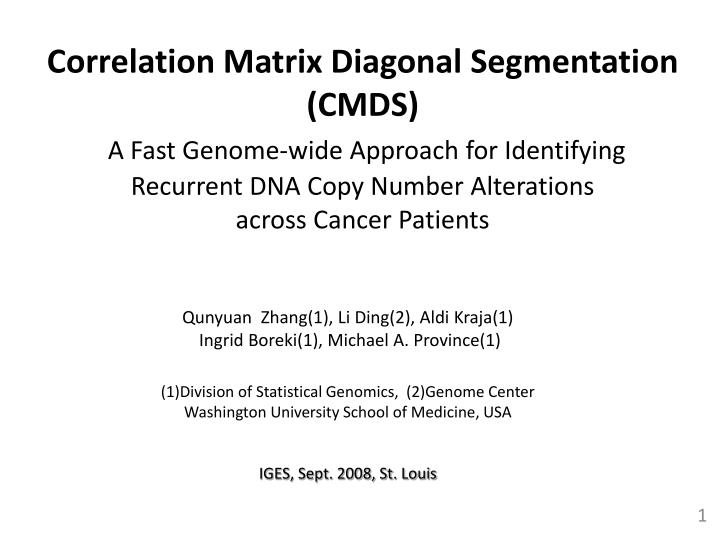
Correlation Matrix Diagonal Segmentation (CMDS) A Fast Genome-wide Approach for Identifying Recurrent DNA Copy Number Alterations across Cancer Patients. Qunyuan Zhang(1), Li Ding(2), Aldi Kraja(1) Ingrid Boreki(1), Michael A. Province(1)

E N D
Correlation Matrix Diagonal Segmentation (CMDS) A Fast Genome-wide Approach for Identifying Recurrent DNA Copy Number Alterations across Cancer Patients Qunyuan Zhang(1), Li Ding(2), Aldi Kraja(1) Ingrid Boreki(1), Michael A. Province(1) (1)Division of Statistical Genomics, (2)Genome Center Washington University School of Medicine, USA IGES, Sept. 2008, St. Louis
Introduction DNA copy number alteration (CNA) is one of the significant hallmarks of genomic abnormality in tumor cells. Identification of recurrent CNA (RCNA) across a cohort of cancer patients may provide an important insight into the molecular mechanism of oncogenesis and produce useful information for the diagnosis and treatment of cancers. Most of current methods for RCNA identification adopt a two-step strategy, which requires discretization (binarization, segmentation or incontinuous smoothing) for each individual sample’s data before searching RCNA regions across multiple samples. Although disretization provides useful CNA pattern or profile for individual samples, it may lose original distribution information when converting raw continuous signals into discretized data, and therefore may deteriorate the overall statistical power of RCNA detection. Besides, individual sample discretization, along with the following multiple sample analysis, may produce in total a heavy computational burden which could impedes the application, especially in the genome-wide studies with high density signals and large sample sizes.
Purpose To develop a fast genome-wide approach, Correlation Matrix Diagonal Segmentation (CMDS), for identifying recurrent DNA copy number alterations (RCNAs) in large scale genome-wide studies at the population level. The approach needs no data discretization for individual samples and directly analyzes the raw data of the entire samples. Here we present: Statistical power (or receiver operating characteristic, ROC) of CMDS under a variety of configurations of multiple factors; Comparison of statistical power and computational efficiency with existing typical discretization-based approach; Application of CMDS to real data from the Tumor Sequencing Project (TSP).
The CMDS Approach (Rationale) Due to the copy number (CN) changes in the same chromosomal region across individuals (slide 6, fig a), RCNA causes co-variation (or correlations) between chromosomal sites within the recurrent region, and therefore diagonally forms a correlation block in the CN correlation matrix of chromosomal sites (slide 6, fig b). As each correlation block corresponds to a RCNA region, RCNA can be identified by detecting correlation blocks along the diagonal of correlation matrix.
The CMDS Approach (Procedure) Prepare copy number (log2 ratio) data as a n×m matrix (X).n=number of samples, m=number of chromosomal sites; (see slide 6, fig a) Calculate Pearson’s correlation coefficients between chromosomal sites i and j (rij); Normalize rij through Fisher’s transformation ( ) and obtain normalized correlation matrix (Z);(see slide 6, fig b) Specify a small square block size b (e.g. b=10) and slide the block along the diagonal of matrix Z . For each block h, calculate: (see slide 6, fig c) Under the null hypothesis that there is no CNA (i.e. no correlation between chromosomal sites), will randomly follow a normal distribution with a mean of 0 and a variance of . Based on this, p-value for each chromosomal block under the null hypothesis can be calculated and then used to determine the significance of RCNA regions. (see slide 6, fig d)
RCNA region RCNA region Illustration of CMDS Raw copy number data of 100 samples and 500 chromosomal sites (red denotes copy number higher than 2) Correlation matrix of 500 sites (white block indicates high correlation RCNA region) Diagonal transformed values Negative log10(P) values for the tests of RCNA region RCNA region
Factors Affecting the Power of CMDS The statistical power of CMDS depends on multiple factors, including: Block size (b) chosen for diagonal transformation Sample size (n) Frequency of RCNA among population (f) Amplitude (i.e. copy number) of RCNA region (c) Total number of chromosomal sites (m) involved in analysis Number of sites within RCNA region (t)
Expected and Observed Type I errors Result is based on 1000 replications of simulation (b=20,n=50,f=0.1,c=3,m=5000,t=50) Conclusion: the P value calculation in CMDS is very close to the expected, which allows a quick test without using re-sampling or permutation technique.
ROC Curves of CMDS Under Multiple Configurations Simulation parameters: n=50,f=0.1,c=3,m=1000,t=10~50(random) b=20,f=0.1,c=3,m=1000,t=30 b=20,n=50,c=3,m=1000,t=30 b=20,n=50,f=0.1,m=1000,t=30 b=20,n=50,f=0.1,c=3,m=1000 b=20,n=50,f=0.1,c=3,t=30 Results are based on 500 replications of Simulation TPR: ture positive rate; FPR: false positive rate
Power Computer Time GLAD-STAC: 2820 seconds (47 min) CMDS: 15 seconds Comparison was performed on DELL OPTIPLEX 755 PC. Both GLAD and CMSD were implemented in R 2.5.1, STAC (permutation number= 10000) was run in JAVA (under Windows XP 5.1). The same data set was used (containing 10000 chromosomal sites and 100 samples). In GLAD-STAC analysis, most time was spent by GLAD. Comparison with Other Approach The figure above shows the ROC curves of CMDS and a typical discretization-based approach, STAC (Diskin et al.,2006). Before STAC analysis, GLAD (Hupe et al., 2004) was used to smooth and discretize individual sample data. Result is based on 500 replications of simulation (b=20; n=50,f=0.1,c=3~4,m=300,t=30) Conclusion: Compared with discretization-based approach, CMDS can obtain higher power with much smaller computer burden.
We apply CMDS to a real data set from the NHGRI Tumor Sequencing Project (TSP), which contains the DNA copy number data of tumor tissues from 371 lung cancer (adenocarcinoma) patients, measured by the Affymetrix Human Mapping 250K STY SNP array. This data set has been analyzed using another discretization-based method (GISTIC) and published elsewhere (Weir et al., 2007). It is now publicly available at www.broad.mit.edu/cancer/pub/tsp/ Our results show that CMDS can identify most of the interesting, important regions that have been reported previously, as well as some novel, unreported regions. (see slides 12~15) Application of CMDS
CMDS Analysis of TSP Data (1) Reported regions with interesting candidate oncogenes EGFR MYC
CMDS Analysis of TSP Data (2) Reported regions with interesting candidate oncogenes CCND1 KRAS
CMDS Analysis of TSP Data (3) Reported regions with interesting candidate oncogenes CDK4 NKX2-1,MBIP
CMDS Analysis of TSP Data (4) Unreported novel regions
Summary CMDS directly analyses raw copy number (log2 ratio) data at the population level; CMDS needs no discretization of individual sample data and adopts an easily implemented and fast diagonal transformation technique, which substantially reduces the computer burden; CMDS exploits correlation information between chromosomal sites, which increases the statistical power of the RCNA identification; CMDS is particularly suitable for the quick search of RCNA regions through genome-wide data from large population; The R code for CMDS analysis (test version, unpublished) can be obtained by E-mail Qunyuan Zhang qunyuan@wustl.edu
References Diskin S J et al. (2006) STAC: A method for testing the significance of DNA copy number aberrations across multiple array-CGH experiments. Genome Research, 16:1149–1158. Hupé P et al. (2004) Analysis of array CGH data: from signal ratio to gain and loss of DNA regions. Bioinformatics, 20:3413–3422. Shah S P et al. (2007) Modeling recurrent DNA copy number alterations in array CGH data. Bioinformatics , 23:450–458. Weir B A et al. (2007) Characterizing the cancer genome in lung adenocarcinoma. Nature, 450: 893-898.