Download
1 / 27
270 likes | 275 Views
The Cost of (Un)Healthy Diets: Novel Food Price Indexes Based on Nutritional Attributes. Yan Bai and William A. Masters Friedman School of Nutrition and Department of Economics, Tufts University. Project collaborators:. Daniel B. Sarpong University of Ghana. Jennifer C. Coates

E N D
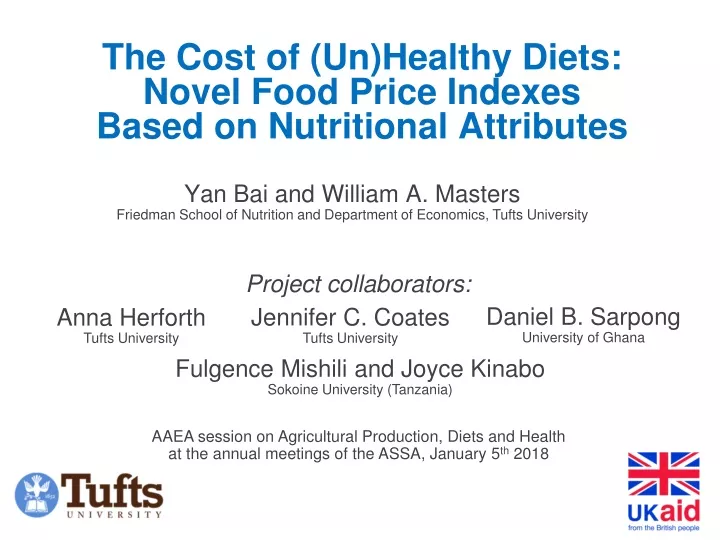
The Cost of (Un)Healthy Diets: Novel Food Price Indexes Based on Nutritional Attributes Yan Bai and William A. Masters Friedman School of Nutrition and Department of Economics, Tufts University Project collaborators: Daniel B. Sarpong University of Ghana Jennifer C. Coates Tufts University Anna Herforth Tufts University FulgenceMishili and Joyce Kinabo Sokoine University (Tanzania) AAEA session on Agricultural Production, Diets and Health at the annual meetings of the ASSA, January 5th 2018
The Cost of (Un)Healthy Diets: Novel Food Price Indexes motivation| food scores | diet diversity | recommended diets | nutrient adequacy | conclusion Adding up foods in terms of nutritional valuesis of great interest to economists • Allen (2017) in AER uses cost of nutrient adequacy to measure global poverty • This works only for “under”nutrition, and counts only some nutrients
The Cost of (Un)Healthy Diets: Novel Food Price Indexes motivation| food scores | diet diversity | recommended diets | nutrient adequacy | conclusion Adding up foods in terms of nutritional valuesis of great interest to economists • Allen (2017) in AER uses cost of nutrient adequacy to measure global poverty • This works only for “under”nutrition, and counts only some nutrients • Allcott et al (2017) uses deviation from US Dietary Guidelines • This doesn’t reflect differences in importance among nutrients
The Cost of (Un)Healthy Diets: Novel Food Price Indexes motivation| food scores | diet diversity | recommended diets | nutrient adequacy | conclusion As food environments change, are healthy diets as defined by nutritionists becoming easier to buy, or further out of reach?
The Cost of (Un)Healthy Diets: Novel Food Price Indexes motivation| food scores | diet diversity | recommended diets | nutrient adequacy | conclusion Here we compare four kinds of indicatorsto add up the cost of foodsin terms of their nutritional values • Unit-free indexes that track change over time • Nutritious-food Price Index (NPI) • Weight prices by nutrient scores, instead of spending level as in CPI • Cost of Diet Diversity (CoDD) • Uses least-cost food from the lowest-cost food groups to reach MDD-W • Cost-per-day values that specify quantities needed • Cost of a Recommended Diet (CoRD): • weights each price by quantities in the recommended diet • Cost of Nutrient Adequacy (CoNA): • the least-cost combination of foods to meet nutrient requirements
The Cost of (Un)Healthy Diets: Novel Food Price Indexes motivation| food scores | diet diversity | recommended diets | nutrient adequacy | conclusion How might we measure the cost and affordability of a nutritious diet? • For foods actually consumed, a very long history • Fleetwood (1707) food price index = 5 ‘quarters’ of wheat, 4 ‘hogsheads’ of beer • Lowe (1823) different baskets for different socioeconomic groups • Jevons (1865), Laspeyres (1871) and many others lead to modern CPI • For affordability of dietary energy, a long history and wide use • Playfair (1821) chart of wheat prices and wages from 1565 to 1821 • Sukhatme (1961) and FAO’s Prevalence of Undernourishment in calories • Drewnowski (2004) measure of energy cost ($/kcal) and density (kcal/kg) • For nutrient adequacy, more recent history and many specific uses • Stigler (1945) linear programming to compute least-cost diets • USDA Thrifty Food Plan for US nutrition assistance (1975, 1983, 1999, 2006) • SCUK Cost of Diet tool (2009) and FANTA et al. Optifood (2012) for aid programs • We also introduce three new concepts: • A nutritionally-weight price index (using NuVal points, from 1 to 100) • A cost of diet diversity index (at least one from each of at least 5 food groups) • A cost of recommended diets index (with quantities from local dietary guidelines)
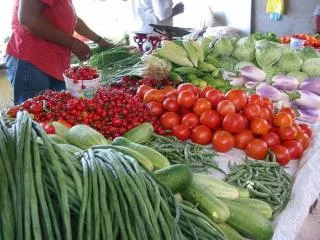
The Cost of (Un)Healthy Diets: Novel Food Price Indexes motivation| food scores | diet diversity | recommended diets | nutrient adequacy | conclusion Food prices can come from many different sources How are food prices now being collected and used? Ghana MoFA enumerator collecting food price data Photo: Anna Herforth, 2017
The Cost of (Un)Healthy Diets: Novel Food Price Indexes motivation| food scores | diet diversity | recommended diets | nutrient adequacy | conclusion The IANDA project helped Ghana MoFA expand price data collection to include more diverse foods Ghana’s Weekly Market Price Reports will soon include the additional foods marked in red, for 20 major markets
The Cost of (Un)Healthy Diets: Novel Food Price Indexes motivation| food scores | diet diversity | recommended diets | nutrient adequacy | conclusion Standard food CPI counts each food in proportion to actual consumption • Standard food CPI: • fCPI = ∑ipiwi , where pi and wi are prices and weights in consumer spending weights each price by quantities actually chosen • Nutritious-food PI (NPI): • NPI = ∑ipiniwi, where ni is a nutrient score, egNuVaL from 1 (worst) to 100 (best) weighting each expense by its nutritional value We can use nutrition scores instead • Nutrition scores aim to guide food choices • We use them to measure whether more nutritious foods are becoming more or less affordable
The Cost of (Un)Healthy Diets: Novel Food Price Indexes motivation| food scores | diet diversity | recommended diets | nutrient adequacy | conclusion In Ghana, have more nutritious foodsbecome more expensive than other foods? Food Price Indexes in Greater Accra, 2012-2017 Prices of more nutritious foods rose less than prices of other foods Food Price Indexes in Tamale, 2012-2017 ...but in Tamale from 2012 to 2014, the opposite occurred
The Cost of (Un)Healthy Diets: Novel Food Price Indexes motivation| food scores | diet diversity | recommended diets | nutrient adequacy | conclusion A popular metric of diet quality is diversity We follow the MDD-W • MDD-W is defined as ≥ 5 of these 10 food groups in past 24 hrs • (1) Starchy staples (Grains, white roots/tubers, plantains) • (2) Pulses (beans, peas and lentils – includes soybeans) • (3) Nuts and seeds (higher fat than pulses, includes groundnuts) • (4) Flesh foods (meat, poultry and fish) • (5) Dark green leafy vegetables • (6) Other vitA-rich fruits & vegetables • (7) Other vegetables; (8) Other fruits; (9) Eggs; (10) Dairy
The Cost of (Un)Healthy Diets: Novel Food Price Indexes motivation| food scores | diet diversity | recommended diets | nutrient adequacy | conclusion We can measure the cost of reaching MDD-W with the least-cost food in each group MDD-W has a direct economic interpretation • Within groups, all foods are equal substitutes • Each group meets different needs, and also contributes to energy balance • Groups can be ranked by cost towards total daily energy balance • People with at least five groups are likely to reach adequacy thresholds The cost of reaching MDD-W can be defined as: • Cost of Diet Diversity (CoDD): • CoDD = Min5{min{pi1}, min{pi2}, …, min{pim}} the least-cost way to include at least one food from at least 5 food groups • CoDD2 = Ave{min{pi1}, min{pi2}, …, min{pim}} the least-cost way to include at least one food from any 5 of the 10 food groups
The Cost of (Un)Healthy Diets: Novel Food Price Indexes motivation| food scores | diet diversity | recommended diets | nutrient adequacy | conclusion 1.Maize or cassava The least-cost food in each group may vary • Foods counted for the Cost of Diet Diversity (CoDD) in Ghana, 2009-14 In Ghana, foods in the five lowest-cost groups are: 5.Fish or banana 4.Mangoes 3.Groundnuts 2.Soya Note: if we ranked foods by weight ($/kg), the least cost starchy staple would always be cassava
The Cost of (Un)Healthy Diets: Novel Food Price Indexes motivation| food scores | diet diversity | recommended diets | nutrient adequacy | conclusion 1.Maize Each food group may have different trends and fluctuations • Foods counted for the Cost of Diet Diversity (CoDD) in Tanzania, 2011-15 In Tanzania, each food group varies differently over time 5.Avocado 4.Beef 3.Groundnuts 2.Soya Note: if we ranked foods by weight ($/kg), the least cost food would often be cabbage
The Cost of (Un)Healthy Diets: Novel Food Price Indexes motivation| food scores | diet diversity | recommended diets | nutrient adequacy | conclusion To measure cost levels (e.g. $/day), we can use the Cost of a Recommended Diet (CoRD) • Traditional food CPI • Nutritious-food CPI (NPI) • Cost of Diet Diversity (CoDD) The previous indexes are unit-free, to measure change over time We measure total cost by specifying quantities consumed • Cost of a Recommended Diet (CoRD): • CoRD = ∑jpijqj , where pij = min{pij} and qj = requirement for j={1,…, m} categories weights each price by quantities in the recommended diet, lowest-cost only • CoRD2 = ∑jpijqj , where pij = median{pij} and qj = requirement for j={1,…, m} categories weights each price by quantities in the recommended diet, all foods equally
The Cost of (Un)Healthy Diets: Novel Food Price Indexes motivation| food scores | diet diversity | recommended diets | nutrient adequacy | conclusion The Cost of a Recommended Diet (CoRD) depends on price and quantity per day With the average of all items in each food group (except dairy), total cost would be US$0.75/day The required portions from each food group cost between $0.15 and $0.25 per day Ghana prices not available for dairy Cost per day for a recommended diet, lowest-cost items only (Ghana, 2015) Cost per day (2011 US$ in PPP terms)
The Cost of (Un)Healthy Diets: Novel Food Price Indexes motivation| food scores | diet diversity | recommended diets | nutrient adequacy | conclusion The most widely-used nutritional standard is nutrient adequacy • The Cost of Nutrient Adequacy (CoNA) is a “least-cost diet” using foods that reach EARs at lowest cost: • Minimize C = Σipiqi • Subject to aijqi > EARj, for j = 1,…, 17 essential nutrients • and aieqi = E , for energy • where pi is price and qi is quantity of food i, and aijis its content in nutrient j, for which EARj is the Estimated Average Requirements for adult women aged 19-30, not pregnant or lactating, at 55 kg with energy use (E) of 2000 kcal/day • We focus on total cost • Disaggregated by food groups, to show diet composition • Disaggregated by nutrients, valued at their shadow prices
The Cost of (Un)Healthy Diets: Novel Food Price Indexes motivation| food scores | diet diversity | recommended diets | nutrient adequacy | conclusion • Cost of Nutrient Adequacy (CoNA) in Ghana, by food group In Ghana, the cost of buying sufficient nutrients rose from 2010 to 2014, largely because vitamin-A rich F&V (e.g. mango) became more expensive
The Cost of (Un)Healthy Diets: Novel Food Price Indexes motivation| food scores | diet diversity | recommended diets | nutrient adequacy | conclusion • Cost of Nutrient Adequacy (CoNA) in Ghana, by limiting nutrient In Ghana, the limiting nutrient whose cost has risen is mainly vitamin A, but the cost of meeting calcium requirements has also risen
The Cost of (Un)Healthy Diets: Novel Food Price Indexes motivation| food scores | diet diversity | recommended diets | nutrient adequacy | conclusion • Cost of Nutrient Adequacy (CoNA) in Tanzania, by food group In Tanzania, there was some rise in CoNA during 2011-12, with many different food groups playing important roles in keeping the cost of nutrients relatively stable
The Cost of (Un)Healthy Diets: Novel Food Price Indexes motivation| food scores | diet diversity | recommended diets | nutrient adequacy | conclusion • Cost of Nutrient Adequacy (CoNA) in Tanzania, by limiting nutrient In Tanzania, there was some rise in CoNA during 2011-12, with many different nutrients as limiting factors
The Cost of (Un)Healthy Diets: Novel Food Price Indexes motivation| food scores | diet diversity | recommended diets | nutrient adequacy | conclusion Conclusions and next steps • Calculating the cost of a nutritious diet is challenging • Need clear definition of “nutritious”. Here we use: • Food scores for nutritional value, modifying standard CPI to calculate NPI • Recommended diets, using dietary guidelines to calculate CoRD • Dietary diversity, using MDD-W to calculate CoDD • Nutrient adequacy, using use EARs for 17 nutrients to calculate CoNA • Underlying data remain limiting • Here, we use prices from MoFA in Ghana, NBS in Tanzania • For Ghana, future studies will include prices for expanded food list • In Tanzania and other countries, need more rural market prices • Our ongoing CANDASA project will: • Assemble prices from additional countries • Test link to prices from climate fluctuations, infrastructure & markets • Test link from prices to diet quality, heights & weights
The Cost of (Un)Healthy Diets: Novel Food Price Indexes motivation| formulas | data | nutrient adequacy | diet diversity | next steps Thank you! This work is funded by UKAid and the Bill & Melinda Gates Foundation (OPP1182628). Model code and data for replication of results will be available on that project’s website at http://sites.tufts.edu/candasa. All results depend on price enumerators! Photo: Anna Herforth, 2017
The Cost of (Un)Healthy Diets: Novel Food Price Indexes motivation| food scores | diet diversity | recommended diets | nutrient adequacy | conclusion Existing food price indexes are weighted by market value and say little about nutritional value World food commodity prices, 2014-2017 For global commodity prices, the FAO Food Price Index consists of five commodity group price indices, weighted with average export shares of each of the groups for 2002-2004. • Total of 23 commodities (73 prices), in 5 groups: • Cereals • -- wheat (11), maize (1), rice (16) • Oils/Fats • -- soybean, sunflower, rapeseed, groundnut, cottonseed, copra, palm kernel, palm, linseed, castor (1 each) • Dairy • -- whole milk powder, skim milk powder, cheese (2 each), cheese (1) • Meat • -- poultry (13), beef (7), pork (6), sheep (1) • Sugar • -- sugar (1) Source: www.fao.org/worldfoodsituation, 29 Sept. 2017
The Cost of (Un)Healthy Diets: Novel Food Price Indexes motivation| food scores | diet diversity | recommended diets | nutrient adequacy | conclusion Within a consumer price index, food price trends and fluctuationsdiffer greatly by type of food Local food prices in the United States, 1970-2016 (index values, 1982=100) Retail prices Food away from home (restaurants etc.) Food at home (groceries) Wholesale prices Processed food & feed Unprocessed food and feed Source: US. Bureau of Labor Statistics, downloaded 29 Sept. 2017. Definitions and chart data are available at http://myf.red/g/ff6v
Summary of formulas Index values: unit-free, no quantities specified • Nutritious-food CPI (NPI): • NPI = ∑ipini , where ni is a food’s health score, egNuVaL from 1 (worst) to 100 (best) weighting each price by its nutritional value, instead of expenditure shares in CPI • Cost of Diet Diversity (CoDD): • CoDD = Min5{min{pi1}, min{pi2}, …, min{pim}} the least-cost way to include at least one food from at least 5 food groups • CoDD2 = Ave{min{pi1}, min{pi2}, …, min{pim}} the least-cost way to include at least one food from any 5 of the 10 food groups Cost per day: specifies quantities needed • Cost of a Recommended Diet (CoRD): • CoRD = ∑jpijqj , where pij = min{pij} and qj = requirement for j={1,…, m} categories weights each price by quantities in the recommended diet, lowest-cost only • Cost of Nutrient Adequacy (CoNA): • CoNA = MiniΣipiqi, where aijq i > EARjand aieq i = E aijis nutrient content of foods, EARj is nutrient requirement of people the least-cost combination of m foods to meet n nutrient needs