Download
1 / 13
130 likes | 226 Views
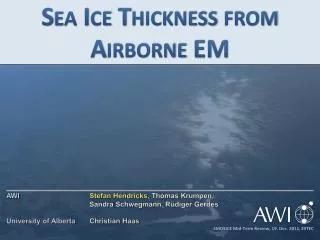
2013 IGS International Symposium on radioglaciology. Firn variability derived from a statistical analysis of airborne ice penetrating radar Thwaites Glacier catchment , West Antarctica -- Cyril Grima , D.M. Schroeder, D.D . Blankenship, D.A. Young. Lawrence, Kansas, USA.

E N D
2013 IGS International Symposium on radioglaciology Firn variabilityderivedfrom a statisticalanalysis of airborneicepenetrating radar Thwaites Glacier catchment, West Antarctica -- Cyril Grima, D.M. Schroeder, D.D. Blankenship, D.A. Young Lawrence, Kansas, USA September 9th, 2013
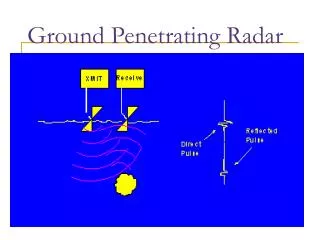
1. THE SURFACE ECHO TOTAL POWER = + Reflectance(coherent) +++Permittivity +++Deterministic structure (layering) + Roughness Scattering(incoherent) +++Roughness +++ Non-deterministic structure (volume) + Permittivity
Demonstrated with SHARAD (Mars) [Grima et al., 2012] 2. STATISTICAL APPROACH Because of the scattered part, the surface echoisstochastic Increasingroughness Amplitude distributions fittedwithHomodyned K-envelope (HK) HK allows within a footprint: few and clustered scatterers + one specular reflector where J0 is the 0th order Bessel function of the first kind =Reflected power (Pc) =Scattered power (Pn) [Dutt & Greenleaf, 1994; Chitroub, 2002; Ward et al., 2006; Destrempes and Cloutier, 2010]
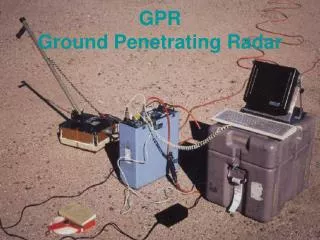
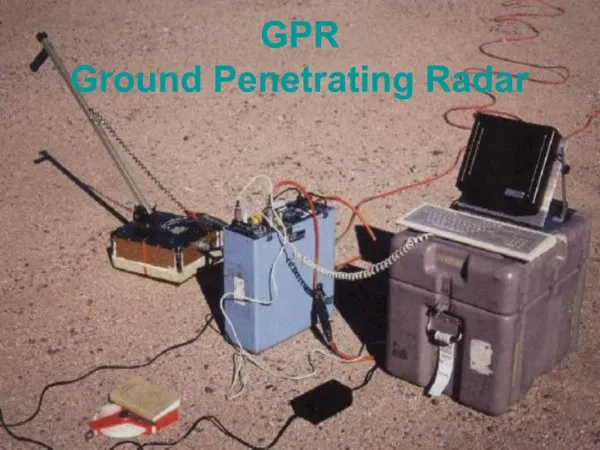
3. APPLICATION OVER THWAITES (AGASEA) • HiCARS radar [Peters et al, 2005,2007] • f = 60 MHz ( = 5 m) • f = 15 MHz • Footprint(along/cross-track) • 30-50 m / 250-350 m • Icethicknesssensitivity • 5-10 m • Amplitude distributions obtainedalong-track • 1000 consecutive observations each
4. RESULTS REFLECTANCE (Pc) SCATTERING (Pn) dB dB correlation betweenamplitudes & HK distribution < 95% i.e. less confident results due to roughness and/or permittivity heterogeneities
5. RMS HEIGHT (h) DERIVATION Small Perturbation Method (SPM) + Nadir approximation + Large correlationlength where U = Pc/Pn [Grima et al, 2012] [Grima et al., in prep.] LASER (@ 100 m baseline) RADAR (@ 5-50 m baseline) ---- SPM 1dB limit
6. PERMITTIVITY() DERIVATION Small Perturbation Method + Nadir approximation + Large correlationlength where [Grima et al, 2012] Real dielectic constant for the first 5-10 m of firn 2 2.2 2.4 2.6 2.8 3 = 0.4-0.5
7. PERMITTIVITY ANOMALY The anomaly( > 2.5) is a vein(30-60 km wide) whosenorthernboundary matches a slope break (0.5°) across the wholedatasetcoverage(~500 km) 0 0.1 0.2 0.3 0.4 > 0.5 Slopes [°] = 0.4-0.5
8. IMPLICATIONS FOR THE SURFACE Whatcouldexplain = 0.4 - 0.5 in a 5-10-m thick slice of ice ?
9. FIRN DENSITY INVERSION [Kovacs et al., 1995] Anomlycouldbe + 200 kg.m-3 Consistent with a 550-kg.m-3criticaldensityat < 9 m in thisregion, as modeled by [Ligtenberg et al., 2011]
10. THE WET LAYER OPTION 3-layers model [fromMouginot et al, 2009] An upper high-permittivity layer with a subwavelenghtthicknessgeneratesconstructive interferences 0 = 1 (Atmosphere) 1 = ?? (> 2 ) ?? Solutions for = 0.4-0.5 2 = 2.3-2.4 1 5-10 m (1)
11. CONCLUSION • Reflectance/scattering components extractedfrom the signal • 500 x 30 km permittivityanomalydetected over Thwaites catchment, coincidentwith a prominentslope break • Higherdensity firn or wetsnow layer • Both indicative of a higher densification rate • Implications for surface mass balance atregionalscale Dual frequencyanalysis (HF/VHF) to solvepermittivity/layeringambiguities Application to bed interface