Download
1 / 26
260 likes | 266 Views
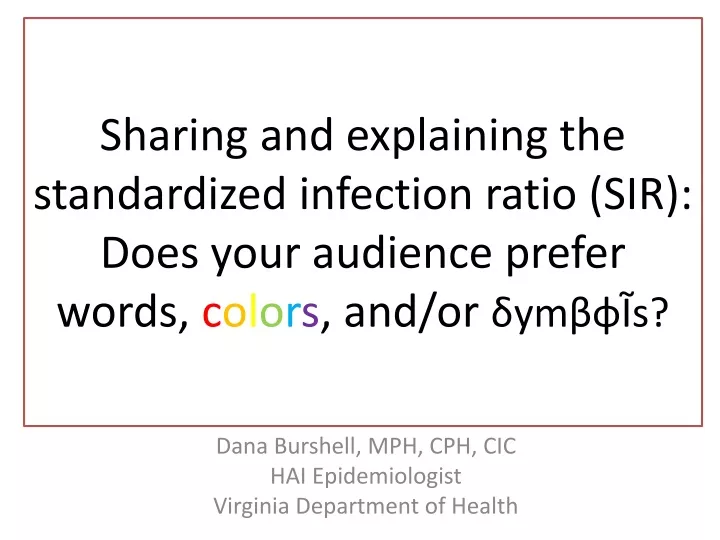
Sharing and explaining the standardized infection ratio (SIR): Does your audience prefer words, c o l o r s , and/or δ ym βφ Ĩs?. Dana Burshell, MPH, CPH, CIC HAI Epidemiologist Virginia Department of Health. What is a standardized infection ratio?.

E N D
Sharing and explaining the standardized infection ratio (SIR): Does your audience prefer words, colors, and/or δymβφĨs? Dana Burshell, MPH, CPH, CIC HAI Epidemiologist Virginia Department of Health
What is a standardized infection ratio? • The standardized infection ratio (SIR) is a summary measure used to track healthcare-associated infections (HAIs) at a national, state, or local level over time. The SIR adjusts for patients of varying risk within each facility. - The National Healthcare Safety Network (NHSN)
The SIR calculation • In HAI data analysis, the SIR compares the actual number of HAIs reported (observed) with the baseline U.S. experience (expected/predicted), adjusting for several risk factors that have been found to be significantly associated with differences in infection incidence. SIR = number of observed (O) CLABSIs number of expected (E) CLABSIs • NHSN aggregate data are used as the standard population and considered the baseline U.S. experience • NHSN baseline data used in an SIR are used to calculate the expected or predicted number of HAIs adjusting for the identified risk factors.
What does the SIR number mean? • Accounting for differences in the types of patient followed: • An SIR greater than 1.0 indicates that more HAIs were observed than predicted. • An SIR less than 1.0 indicates that fewer HAIs were observed than predicted. • An SIR equal to 1.0 indicates the same number of HAIs were observed than predicted. • However, the SIR alone does not imply statistical significance.
Statistical significance of the SIR:P-value and 95% confidence intervals • The SIR is only a point estimate and needs additional information to indicate if it is statistically significantly different from 1. • A 95% confidence interval (CI) and a p-value are calculated by NHSN for each SIR and determines statistical significance. • A 95% CI assesses the magnitude and stability of an SIR. Therefore, a 95% CI is the range of estimated SIR values that has a 95% probability of including the true SIR for the population. • If the 95% CI does not contain the value 1, the SIR is "statistically significant". • If the p-value is less than 0.05, the SIR is “statistically significant".
Explaining and interpreting the SIR: Virginia data During the third quarter of 2011, there were 58CLABSIs identified and 46,058central line days observed in Virginia adult intensive care units. Based on the NHSN 2006-2009 baseline data and the composition of locations in Virginia facilities, 87.323 CLABSIs were expected. This result is an SIR of 0.664 (O/E= 58/87.323), signifying that during this time period, Virginia facilities identified 34% fewer CLABSIs than expected. The p-value (0.0006) and 95% confidence (0.504, 0.859) interval indicate that the number of observed CLABSIs is statistically significantly lower than the number of expected CLABSIs. (Reminder: If the p-value is less than 0.05 and the 95% CI does not cross 1, the SIR is statistically significant.)
What does a significant SIR mean? • While in many cases, significantly high SIRs may reflect a need for stronger prevention efforts for the given type of infection and significantly low SIRs may support already existing strong prevention efforts for that infection type, several other factors such as validation of reported data may play a role. • The real measure of success will come when SIRs can be followed over time to indicate if positive progress occurs and is sustained. The ultimate goal is zero HAIs, so efforts are never complete.
Central line-associated bloodstream infection (CLABSI) standardized infection ratio (SIR) by quarter, Virginia adult intensive care units, 2009-2011 Trendline added using Excel to visually show overall decrease over time Line graph of SIR point estimates • Since 2009, Virginia facilities have identified fewer CLABSIs than expected in adult ICUs, • reflecting already existing strong infection prevention efforts. • Although there is not a consistent decrease in SIR from quarter to quarter, the overall trend since 2009 has been a downward one. • Because the ultimate goal is sustaining zero CLABSIs, individual hospitals should continue effective prevention efforts and identify and address areas for improvement when they occur.
How to generate NHSN SIR outputs • Log into NHSN --> enter the Patient Safety Module • Starting from the blue navigation menu on the left, click “Analysis” --> “Generate Data Set” --> “Generate New” (note: this will take some time to load) • Click “Analysis” --> “Output Options” • On the white screen, click “Device-Associated Module” --> “Central Line-Associated BSI” --> “CDC Defined Output” --> “SIR – In-Plan CLAB Data” • Select “Run” for data aggregated by 6-month intervals and CDC location type or select “Modify” to customize the output
SIR data presentation: Components to consider Always customize for your audience whenever possible.
The following slides show how some states have included certain SIR and visual components for public reporting: • Which components do you think are important? • Which examples would be most useful for you and the audiences within your settings?
Table (color and words)New Hampshire † = Less than 1 HAI expected
Table (color and symbols)Maryland: Chosen by and designed for consumers
Horizontal bar graph (color and visual)Maryland: Chosen by and designed for clinicians
Horizontal bar graph (color, visual)Tennessee comparison to national and state rates
Vertical bar graph (visual)Tennessee ICU type
Vertical bar graph (visual):Tennessee comparison to state SIR ICU type
Horizontal bar graph (color, visual)Virginia explores the SIR Observed number of infections similar to expected (not statistically significant) Fewer infections than expected (statistically significant) More infections than expected (statistically significant) No infections
Building your SIR report: Choosing components Please share your templates and/or reports with the VDH HAI Team.
About Data Presentation • Research shows that when healthcare facilities are aware of their infection issues and implement concrete strategies to prevent them, rates of certain hospital infections can be decreased by more than 70 percent. • Infection data can give healthcare facilities, patients, and public health agencies the knowledge needed to design and implement prevention strategies that protect patients and save lives.
Benefits of Data Presentation • Increase awareness of HAIs • Feed back data to those who can make a difference • Provide benchmark data to support improvement initiatives • Keep HAIs in the spotlight
Resources • CDC's National Healthcare Safety Network (NHSN) Healthcare-associated Infections Summary Data Reports Q and A • http://www.cdc.gov/HAI/surveillance/ QA_statesummary.html • NHSN e-News: SIRs Special Edition • http://www.cdc.gov/nhsn/PDFs/Newsletters/ NHSN_NL_OCT_2010SE_final.pdf
Data quality resources • Use your Alerts to help ensure your data are accurate • Alerts Guide: http://www.cdc.gov/nhsn/PDFs/pscManual/NHSN-Alerts_6_5.pdf • Helpful Tips for CLABSI Reporting for the Centers for Medicare and Medicaid Services’ Hospital Inpatient Quality Reporting Program (CMS Reporting Program) • http://www.cdc.gov/nhsn/PDFs/HelpfulTips_CLABSI_ Reporting.pdf