Download
1 / 35
350 likes | 353 Views
Presented by Tom Hamill Forecasts and assimilations : Carla Cardinali , ECMWF Data analysis : Fanglin Yang, NCEP also: Sharanya Majumdar, RSMAS, U. Miami. ESRL.

E N D
Presented by Tom Hamill Forecasts and assimilations : Carla Cardinali, ECMWF Data analysis : Fanglin Yang, NCEP also: Sharanya Majumdar, RSMAS, U. Miami ESRL Impact of Targeted Dropsonde Data onMid-latitude Numerical Weather Forecastsduring the 2011 Winter Storms ReconnaissanceProgram presentation to THORPEX DAOS, September 2012, Madison, WI, USA
Motivation for this study • THORPEX DAOS has been looking for a clear statement on the impact of targeting in the mid-latitudes since the inception of this committee. • Members have been skeptical that optimistic prior results may not be replicable today with modern assimilation and forecast systems. • Targeting concept with in-situ observations may be difficult, for suggested target areas are much broader than tracks that can be covered in a single plane sortie.
Agreed-upon project to test concept • NOAA supplies a winter’s worth of targeted dropsonde observations to ECMWF (Jan-Mar 2011; 98 flights, 776 dropsondes). • ECMWF runs parallel forecast and assimilation cycles, with and without targeted observations added to the full data stream. • Data assimilation: 4D-Var, inner loops linearized T255, T159, T159. Outer loop, nonlinear T511. 10-member perturbed-obs 4D-Var at T159 to set background-error variances in 4D-Var. • Deterministic forecast to 120 h, T511. • IFS version 37r2
Targeting procedure • Potential high-impact cases identified in advance by NCEP Hydrometeorological Prediction Center scientists. Downstream locations (“verification region”) and times of expected maximum impact are selected • Anticipated high/medium/low impact also noted. • Target lead times defined by forecasters, 12 to 120 h. • ETKF summary map guidance of signal variance within the verification region, together with ETKF selections of optimal flight tracks, are computed. • ~ Two days prior to flight, targeting request sent out. Flights deployed from Anchorage, Yokota, Honolulu, Gulf of Mexico (Biloxi MS). • Assimilation: • “CONTROL” – includes dropsonde data • “NODROP” – excludes dropsonde data
Norm to evaluate impact • An approximation to the total energy norm
Impact as a function of target lead time Verification area here is a +/- 10 degree box centered on target Solid line: mean Dashed line: +/- 1 standard deviation.
Scatterplot of impacts Verification area here is a +/- 10 degree box centered on target cases above line indicate benefit from targeted data
ETS and BIA, eastern US, 24-48 h forecasts nodrop nodrop
Precipitation Threat Skill Scores over CONUS12-36 hour Forecast Entire CONUS Western CONUS No statistically significant differences
Precipitation Threat Skill Scores over CONUS60-84 hour Forecast Entire CONUS Western CONUS No statistically significant differences
500hPa HGT Anomaly Correlationover Pacific North American Region (20N-75N, 180E-320E) 10 Jan 2011 – 28 Mar 2011 mean All verified against “CONTROL” analyses negative numbers = + impact from dropsondes No statistically significant impact
850hPa Temperature Anomaly Correlationover Pacific North American Region (20N-75N, 180E-320E) “nodrop” is significantly worse than “cntl” at initial forecast hours but may be due to incestuous relation w. analysis.
RMSE for Height, Temperature and Windover Pacific North American Region (20N-75N, 180E-320E) “nodrop” has larger RMSE than “cntl” at initial forecast hours. Again, probably fictitious increase in skill.
Z500 AC, NODROP-CONTROLPNA region Below 0 line = + impact from targeted obs
Z500 RMS, NODROP-CONTROLPNA region Above 0 line = + impact from targeted obs
T850 AC, CONTROL-NODROP, PNA region Below 0 line = + impact from targeted obs
T850 RMS, NODROP-CONTROLPNA region Above 0 line = + impact from targeted obs
Conclusions • No evidence from this study that targeted observations has a statistically significant positive impact on forecasts. • Possible reasons: • + impact might be there w. larger sample size. • Not fully sampling target region with ~ 8 dropsondes/flight. • Abundance of other data, higher-quality assimilation systems. • Recommendation: WSR cannot be justified as currently configured based on improvement to forecasts. Reallocate resources to higher priorities?
Weather Forecast Mapsfrom Selected Cases Please visit http://www.emc.ncep.noaa.gov/gmb/wx24fy/vsdb/wsr2011_00Z/fcstmaps/fcstmap.html to see all cases for the period from 09Jan2011 through 28Mar2011.
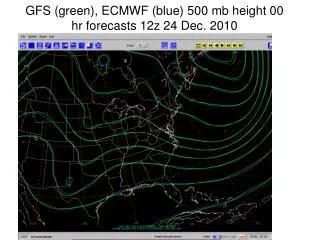
Cases I: 2011012800 CycleJanuary 31 – February 2, 2011 Groundhog Day Blizzard Analyses 500hPa T and Z 850hPa T and Z Notice the differences in northeastern Pacific, presumably caused by the differences in dropsondes
Cases I: 2011012800 CycleJanuary 31 – February 2, 2011 Groundhog Day Blizzard 24-hr Fcst Precip and SLP 500hPa T and Z 850hPa T and Z Differences still in Northeast Pacific
Cases I: 2011012800 CycleJanuary 31 – February 2, 2011 Groundhog Day Blizzard 48-hr Fcst Precip and SLP 500hPa T and Z 850hPa T and Z Differences near the northwest coast
Cases I: 2011012800 CycleJanuary 31 – February 2, 2011 Groundhog Day Blizzard 72-hr Fcst Precip and SLP 500hPa T and Z 850hPa T and Z minor snowfall differences in Northwest
Cases I: 2011012800 CycleJanuary 31 – February 2, 2011 Groundhog Day Blizzard 96-hr Fcst Precip and SLP 500hPa T and Z 850hPa T and Z Snowfall differences are still negligible
Cases I: 2011012800 CycleJanuary 31 – February 2, 2011 Groundhog Day Blizzard 120-hr Fcst Precip and SLP 500hPa T and Z 850hPa T and Z Rather large difference in precipitation; however, precip distribution pattern and the east-coast low pressure system aren’t very much different.
Cases II: 2011030100 CycleEast Coast Storm Analyses 500hPa T and Z 850hPa T and Z Notice the differences of a trough in eastern Pacific, presumably caused by the differences in dropsondes
Cases II: 2011030100 CycleEast Coast Storm 24-hr Fcst Precip and SLP 500hPa T and Z 850hPa T and Z The “nodrop” forecast developed the low system slightly deeper than did the “cntl” forecast.
Cases II: 2011030100 CycleEast Coast Storm 48-hr Fcst Precip and SLP 500hPa T and Z 850hPa T and Z Minor differences in precipitation near the British Columbia coast. “nodrop” had slightly less snow near the coast.
Cases II: 2011030100 CycleEast Coast Storm 72-hr Fcst Precip and SLP 500hPa T and Z 850hPa T and Z The trough moved to the east of Rockies
Cases II: 2011030100 CycleEast Coast Storm 96-hr Fcst Precip and SLP 500hPa T and Z 850hPa T and Z The trough moved to the central Great Plains
Cases II: 2011030100 CycleEast Coast Storm 120-hr Fcst Precip and SLP 500hPa T and Z 850hPa T and Z Large difference in east-coast precipitation East Coast Low development differed
More information on project • For background information about the WSR 2011 Project please visit http://www.emc.ncep.noaa.gov/gmb/targobs/wsr2011/wsr2011.html • Decoded GRIB1 data are saved on NCEP CCS/Cirrus: /global/noscrub/wx24fy/WSR/ecmwf 35