Download
1 / 65
650 likes | 754 Views
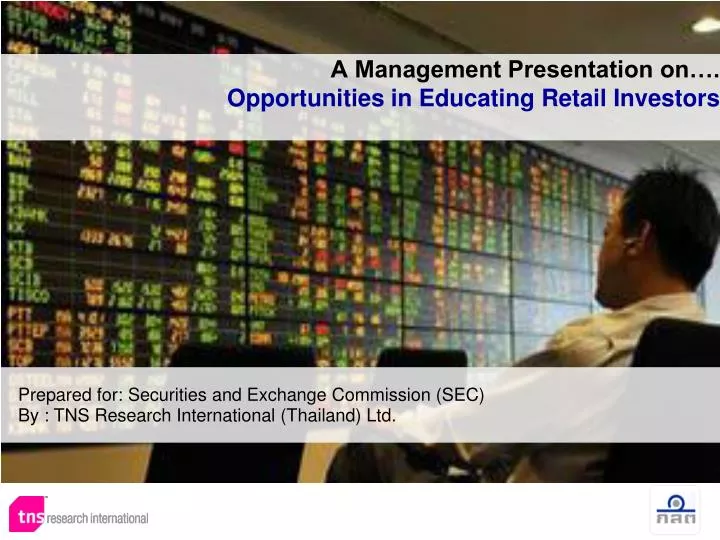
A Management Presentation on…. Opportunities in Educating Retail Investors. Prepared for: Securities and Exchange Commission (SEC) By : TNS Research International (Thailand) Ltd. Project Background & Objectives. Report Flow. Research Design & Sample Structure.

E N D
A Management Presentation on…. Opportunities in Educating Retail Investors Prepared for: Securities and Exchange Commission (SEC) By : TNS Research International (Thailand) Ltd.
Project Background & Objectives Report Flow Research Design & Sample Structure Overview of General Investor’s Market Incidence Investor’s Profile Current Investment Behavior Potential Investors Existing Investors
Project Background • The Securities and Exchange Commission (SEC) Thailandwas established in 1992 and as the capital market supervisory agency with the status of an independent state agency. • The SEC’s 2010 - 2012 strategic plan focuses on four major goals: • Maintain orderly market • Ensure investors protection • Foster business innovation • Promote competition • To help achieve its goals, one of SEC’s requirements is to determine what retail investors know about investment in the capital market in order to educate them via an appropriate communications strategy. Page 4
Overall Research Objectives Primary Objectives To identify if the level of knowledge and understanding of retail investors have about the capital market is sufficient to protect their interests, as well as identify areas of improvement To explore awareness and attitudes towards SEC’s role as an information and knowledge provider and its role in investor protection To understand the (information) needs of retail investors and their preferred communication channels in order to develop appropriate investor education strategies Secondary Objectives To explore the incidence of existing investors and potential investors amongst a target consumers To understand current investment behaviour in relation to SEC-regulated investment products To understand what drives investment in various investment products in order to develop future strategies Page 5
Research Approach To help profile and investigate attitudes, needs and behaviour of the Thai investors market, a 2-step methodology was applied. Step 1: Random survey of a cross section of Thai adults with sufficient monetary potential to invest in SEC regulated investment products to understand the incidence of non-investors, lapsed investors, potential investors and existing investors. Step 2 : Target specific adults who are already existing investors of SEC regulated products - to provide a deeper understanding of how existing investors thought about and made their investment decisions.
Bangkok, North (Chiang Mai, Nakorn Sawan), South (Song Khla, Phuket), Northeast (Nakorn Ratchasima, Khon Kaen) Overall Sample Design& Timing Method Quantitative Face to Face Interviews General Profile Male / Female, aged 20 years old and above Do not include people who work in Bank, Financial Institutions, Ads Agency, and Market Research company Have either personal income over 25,000 Baht/month (if working), or household income over 40,000 Baht/month (if non-working) Sample size Step 1: N = 750 via Random Sampling of Target Respondents Bangkok (50%) – n=375 and Upcountry (50%) – n=375 (equally spread across pre-selected provinces) Step 2: N=250 booster interviews amongst existing investors via Quota sampling Area covered 16 January 2010 – 09 February 2010 Field dates
Incidence Level of Investors Amongst Key Target Audience The incidence of existing investors is around 4.5% from the target group (i.e. Male / Female, aged 20 years old and above and have either a personal income over 25,000 Baht/month (if working), or household income over 40,000 Baht/month (if non-working) Total Contacts (N=5,629) 100% Total Interviews (N=3,430) Rejected (N=2,199) 61% 13% Target Profile Achieved (N=750) Not Qualified (N=2,680) 100% Lapsed investors (N=13) Non-investors (N=660) Potential investors (N=43) Existing investors (N=34) 0.7% 0.2% 11.7% 0.6% 4.5% 1.7% 88% 5.7%
Incidence Level of Investors Amongst Key Target Audience (By Region) The incidence of existing investors in Bangkok is a bit higher than in upcountry while the incidence of potential investors occurs mostly in upcountry. Total Contacts (N=3,091) Total Contacts (N=2,538) 100% 100% Total Interviews (N=1,614) Total Interviews (N=1,816) Rejected (N=1,275) Rejected (N=924) 63.5% 59% 14.7% 12% Target Profile Achieved (N=375) Target Profile Achieved (N=375) Not Qualified (N=1,441) Not Qualified (N=1,239) 100% 100% Lapsed Investors (N=7) Lapsed Investors (N=6) Potential Investors (N=27) Potential Investors (N=16) Existing Investors (N=18) Existing Investors (N=16) Non-Investors (N=326) Non-Investors (N=334) 0.5% 1.1% 0.2% 0.2% 10.8% 12.8% 0.6% 0.6% 4.3% 4.8% 1.9% 1.6% 89.1% 86.9% 4.2% 7.2% Incidence of Target Investors (Upcountry) Incidence of Target Investors (Bangkok)
Reasons For Not Investing (Non-Investors)Base: Those who do not hold any investments (n=660) The main reason that most of the target group do not invest in financial investment products is due to lack of product knowledge. Economic uncertainty is also a key barrier Fig in% Fig in% Ref. S7-S10, S12
Reasons for stopping investment (Lapsed Investor)Base: Those who invested in past year but currently do not hold any (n=13*) Lapsed Investors stopped investing because they needed their money to invest for another purpose and because of worries about the economic recession Fig in% Recent Product Invested Stocks 4 # Mutual Funds 9 # Ref. S7-S10, S11
Potential Investor’s Hopes and Fears Base: Those who plan to invest in the next 12 months (n=43) Potential investors will look to invest in mutual funds (60%) followed by stocks (33%). Lack of product knowledge and fear of the economic recession are reasons for not investing Fig in% Interest to Invest in Next 12M n=43 Ref. S7-S10, S12
Investment amongst Existing Investors (1)Base: Those who are currently investing - Random (n=34) Amongst existing investors in the general population, mutual funds are the key product invested in. Fig in% Currently Investing Fig in% Spending Most Investment In Fig in% Ref. S7-S10
However, looking deeper into to the total existing investors market, there is higher investment in stock (58%) though mutual funds (37%) remain a key product for investment. Investment amongst Existing Investors (2)Base: Those who are currently investing – Total Boosters (n=250) Currently Investing Fig in% Spending Most Investment In Fig in% Ref. S7-S10
Stocks 38% 6% 15% 2% 2% 2% 1% 1% 1% - % Bonds 1% Derivatives 30% Mutual Funds Investment amongst Existing Investors (3)Base: Those who are currently investing – Total Boosters (n=250) Looking at the overall portfolio, 38% are investing only in stocks, with 30% only in mutual funds. The rest have a spread across several investment products with the greatest overlap (at 15%) between these two products. Investors’ other products in portfolio Fig in% Ref. S7-S10
Overall Investors’ ProfileBase: Potential Investors & Existing Investors Married women form a majority of investors – though this may in part, be a function of their availability when interviews were carried out. Existing investors have a slightly higher skew in education and household income. Fig in% Potential investors N=43 Existing investors N=250 Profile Women 65% 65% Working Full Time 95% 76% Married/ Living Together 60% 62% Age Below 40 years old 66% 51% Below 50 years old 89% 81% Core Age: 30-39 yrs old 47% 39% Monthly Household Income 40,000 – 59,999 Baht 56% 24% 28% 74% 60,000 Baht or more Education Level Completed Secondary/Vocational 33% 10% Completed Bachelor’s degree or higher 58% 83% Ref. S2-S4,S6,D1-D2,
Looking at total existing investors, around 40% have less than 3 years experience in investment. At the other end of the spectrum, 20% have more than 10 years experience. Based on this difference, the survey found some key differences in investment behavior and thus, existing investors will also be explored on this basis. Investment Experience amongst Existing Investors Base: Those who are currently investing – Total Boosters (n=250) Fig in% Ref. Q4
Investors’ Profile based on Years of ExperienceBase: Potential Investors & Existing Investors It appears that the profile of investors who have invested for less than three years are skewed towards individuals who are single, younger and working full time. Fig in% Potential investors N=43 Existing investors N=250 Existing < 3 yrs N=98 Existing > 3 yrs N=152 Profile Women 65% 64% 65% 64% Working Full Time 95% 66% 76% 90% Married/ Living Together 60% 72% 62% 48% Age Below 40 years old 66% 51% 75% 36% Below 50 years old 89% 81% 97% 71% Core Age: 30-39 yrs old 47% 39% 31% 51% Monthly Household Income 40,000 – 59,999 Baht 56% 24% 24% 23% 60,000 Baht or more 28% 74% 74% 73% Education Level Completed Secondary/Vocational 33% 14% 5% 10% Completed Bachelor’s degree or higher 58% 79% 83% 90% Ref. S2-S4,S6,D1-D2,
Amongst potential investors, 86% plan to be long term investors with their portfolio comprising a range of different investment products designed to meet their medium to long term needs. Fewer than 15% plan to be short term investors. Investment Style Base: Potential investors (n=43) Investment Timeframe Fig in% Ref. Q5
Primary reason for investmentBase: Potential investors (n=43) The primary reason for investing are to achieve better returns than bank deposits (65%), with quick profits a distant second (35%) Other reasons are controlling the budget and personal/household spending (33%) and (using the investments as a vehicle for) saving for a specific purpose (33%) Reasons to invest Fig in% Ref. Q9, Q10, Q11
Potential investors tend to be single (35%) and young families (33%). Thus, their investment approach is to be more cautious/ prudent (74%) in which they have a balanced portfolio delivering on both medium to long term financial goals, and which will whether changes in tax levels and inflation. Current stage of life & Risk Acceptance from the investmentBase: Potential investors (n=43) Current stage of life Fig in % Risk Acceptance Fig in % Ref. Q1, Q12
Familiarity with investment products is a key issue for potential investors with two thirds not at all or only slightly familiar with the products they plan to invest in. This, of course, is a potential barrier to investment and a continued focus on education is required Overall Familiarity with Investment ProductsBase: Potential investors (n=43) Overall Knowledge Toward Investment Products Fig in % Ref. Q6
Stocks and mutual funds are products that potential investors tend to be most familiar with and thus explaining why these products are often most invested in Overall Familiarity with Specific Investment ProductsBase: Potential investors (n=43) Fig in % Ref. Q7
Products Interested in Investing Base: Potential investors (n=43) Potential Investor’s signal most interest in investing in mutual funds and this may stem from comparatively greater product knowledge but also …. Interest in Investing in Next 12 Months Fig in % Ref. S7
Perception About Level of RisksBase: Potential investors (n=43) Interest in investment in mutual funds may be borne from the fact that they are generally considered lower risk than either stocks, bonds and derivatives Perception about Level of Risk Fig in % 37% 49% Ref. Q13
Investment Decision-MakingBase: Potential investors (n=43) Given the general lack of familiarity with investment products, it is not surprising to see that investment professions play a key role in investment decision making. SEC clearly needs to work this group not only to promote its own role but also as a means to reaching potential investors Investment Decision-Making Approach Fig in % 86% Ref. Q2
Perusal of Investment DocumentsBase: Potential investors (n=43) Potential investors do however recognise the value of due diligence and will therefore, carefully read all documentation before signing Perusal of Investment Documents Fig in % Ref. Q26
Source of Information for Investment Products Base: Potential investors (n=43) The key sources of information re investment products are bank staff (70%), TV–general programs (63%) followed by investment professionals/contacts (i.e. broker/asset management companies) (44%) & fund fact sheets (44%). Bank staff are noted as the most important source of information. Fig in % Main sources of information Top 3 Sources 1st Rank UPC Ref. S13, S14
Source Of Information For Each Investment ProductBase: Potential Investors (N=43) Brokers (44%), bank staff (44%) and a co’s corporate documents (37%). are the main sources of information for stocks. For mutual funds, potential investors look to bank staff (65%), fund fact sheet (33%) & Govt orgs (33%). Over 25% do not know where to get information from for bonds and derivatives, though around 30% would expect the bank staff to be knowledgeable. Fig in % Stocks (a) Mutual Funds (b) Bond (c) Derivatives (d) Alphabets = significant difference over the specified column at 95% confidence level Ref. Q8
Bank staff and parents/relatives are deemed the more reliable sources when potential investors are seeking specific information of certain products. Person most relied for the advice …Base: Potential investors who are looking at specific investment products Person most relied on for advice Fig in % Advice in Mutual Fund n=26* Stocks, Bonds, & Derivatives n=17* *small base, pls. read with caution. Note: For the group of Stocks, Bonds & Derivatives, the major of the investors’ decision could depend mostly on the stocks Ref. Q3a,Q3b
While a majority of existing investors (also) invest for the long term, they tend to be more focused, holding 2-3 key products and actively trade others. This is unlike potential investors who hold more diversified portfolio’s (most likely in an attempt to spread their risk) Investment Style Base: Existing Investors (n=250) Investment Timeframe Existing Investor n=250 Potential Investor n = 43 Fig in % Ref. Q5
Experience amongst Existing InvestorsBase: Existing Investors (n=250) Based on the number of years of experience, more experienced investors (3yrs+ investment experience) are significantly more likely to invest in stocks (70%) while less experienced investors take up mutual funds (57%). Additionally, the investors with 3-7 years of experience are likely to invest more in mutual funds than those who have experience 7 years and above. Investment Experience Fig in % Investment Product from Investment Experience Fig in % Less than 3 yrs, n=98 3 yrs above, n=152 3-7 yrs, n=81 7-10 yrs or more, n=71 Ref. Q4
Primary reason for investmentBase: Existing investors (n=250) The top reasons for investing are similar to potential investors but as we see the focus on financial returns is far stronger for existing investors with 83% saying they invest to achieve better returns than bank deposits and 51% stating a desire/expectation of quick profits. In the aspect of investment experience, the investors with 3-7 years of experience also think about tax privilege, budget allocation, and inflation than those who have higher experience as well. Reasons for investing Fig in % Existing Investor n=250 3 – 7 yrs. n=81 7 – 10 yrs. or more n=71 Key reason amongst young families Ref. Q9
Primary reason for Investment in Specific Products (1)Base: Existing investors (n=250) The key reason to choosing Stock, Bond & Derivative is based on gaining a good return on the investment made (62%). Investing in stocks, bonds and derivatives is also mainly influenced by market sentiment (44%) as well. Additionally, risk diversification and ease of trading are also the key triggers in an investing in stocks, bonds and derivativesfor the investors with 3-7 years of experience than those higher experience. Influence on Investment Decision Stock, Bond & Derivative n=175 Fig in % 3 – 7 yrs. n=63 7 – 10 yrs. or more n=64 Note: For the group of Stocks, Bonds & Derivatives, the major of the investors’ decision could depend mostly on the stocks Ref. Q10, Q11
Primary reason for Investment in Specific Products (2)Base: Existing investors (n=250) Besides the key reason in choosing mutual funds for a good return on the investment (62%), mutual fund investors are also influenced by wanting to diversify (spread) the level of risk they are exposed to (29%). Furthermore, the investors with 3-7 years of investment experience also think about asset management company’s reputation, tax privilege, capital available as the key issues for an investment in mutual funds than those higher experience as well. Influence on Investment Decision Mutual Fund n=125 Fig in % 3 – 7 yrs. n=35 7 – 10 yrs. or more n=26 Note: For the group of Stocks, Bonds & Derivatives, the major of the investors’ decision could depend mostly on the stocks Ref. Q10, Q11
Current Life StageBase: Existing Investors (n=250) Existing investors cover the broad spectrum of life stages however, when looking at the level of investment experience we see that existing investors with less than 3yrs investment experience tend to be singles (45%) whereas investors with more (3yrs +) experience are more likely to be mature families or heading towards retirement. Current stage of life Fig in % Fig in % Investment Exp. (3yrs+) N=152 Investment Exp. (<3 yrs) N=98 Ref. Q1
Risk Acceptance Base: Existing Investors (n=250) When looking at risk acceptance profiles, around 60% of existing investors classify themselves as more cautious/prudent. However this changes quite significantly with experience - more than half (51%) of more experienced investors see themselves as being assertive or aggressive in terms of their acceptance of risk Risk Acceptance Fig in % Investment Exp. (3 yrs+). N=152 Investment Exp. (< 3 yrs). N=98 Fig in % Ref. Q12
Existing investors tend to be more independent in their decision making than are (less experienced and) potential investors with 70% rarely or only using advisers for specialist needs. Investment decision-making approachBase: Existing Investors (n=250) Investment Decision-Making Approach Fig in % Ref. Q2
Perusal of Investment DocumentsBase: Existing Investors (n=250) Existing investors are less prone (than potential investors) to reading investment document, perhaps due to experience and confidence but this is an area that SEC needs to remind investors of the need to be diligent. Perusal of Investment Documents Fig in % Ref. Q26
Investment Confidence Amongst Existing InvestorsBase: Existing Investors (n=250) 60% of existing investors feel that they spend an ‘average amount of time’ in making their investment decisions but over 80% are confident in the investment decisions they make. They also consider themselves be adaptable and able to cope with adverse situations. Time taken to make investment decision Confidence in Investment decision Adapt for unfavorable financial change Fig in % Fig in % Fig in % 24% 88% 84% Ref. Q14-Q16