1 / 2

83 = 66% 94 = 75%

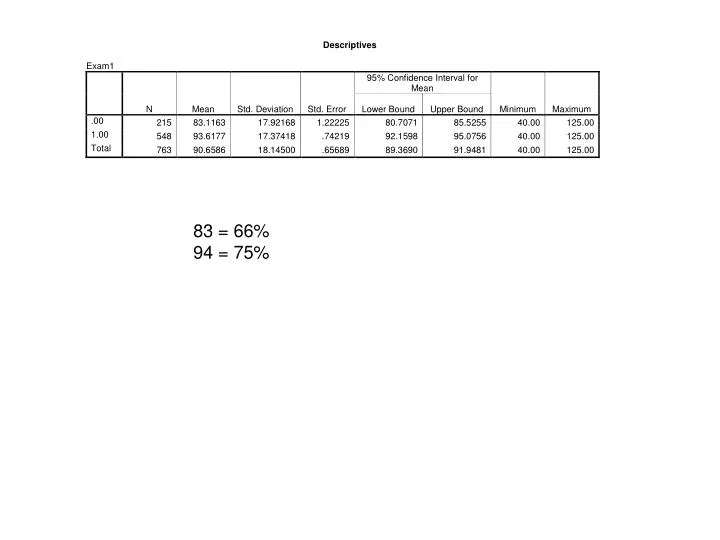
83 = 66% 94 = 75%. Descriptives Exam1 N Mean Std. Deviation Std. Error 95% Confidence Interval for Mean Minimum Maximum Lower Bound Upper Bound .00 225 84.4389 17.69338 1.17956 82.1144 86.7633 40.00 125.00 1.00 538 93.2598 17.70926 .76350 91.7599 94.7596 40.00 125.00

Download Presentation

83 = 66% 94 = 75%

An Image/Link below is provided (as is) to download presentation Download Policy: Content on the Website is provided to you AS IS for your information and personal use and may not be sold / licensed / shared on other websites without getting consent from its author. Content is provided to you AS IS for your information and personal use only. Download presentation by click this link. While downloading, if for some reason you are not able to download a presentation, the publisher may have deleted the file from their server. During download, if you can't get a presentation, the file might be deleted by the publisher.

E N D

Presentation Transcript


  1. 83 = 66% 94 = 75%

  2. Descriptives Exam1 N Mean Std. Deviation Std. Error 95% Confidence Interval for Mean Minimum Maximum Lower Bound Upper Bound .00 225 84.4389 17.69338 1.17956 82.1144 86.7633 40.00 125.00 1.00 538 93.2598 17.70926 .76350 91.7599 94.7596 40.00 125.00 Total 763 90.6586 18.14500 .65689 89.3690 91.9481 40.00 125.00 84 = 67% 93 = 74%

More Related