Download
1 / 15
150 likes | 223 Views
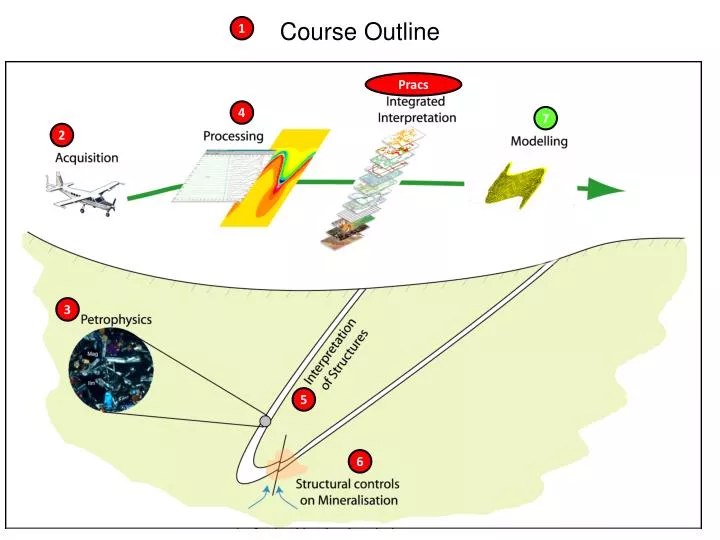
1. Course Outline. Pracs. 4. 7. 2. 3. 5. 6. Mineral Potential Mapping. Knowledge Driven Expert-system Based on the expert assessment of the processing geologist, rely on the definition and spatial processing of relevant metallogenic parameters for a selected model

E N D
1 Course Outline Pracs 4 7 2 3 5 6
Mineral Potential Mapping • Knowledge Driven • Expert-system • Based on the expert assessment of the processing geologist, rely on the definition and spatial processing of relevant metallogenic parameters for a selected model • e.g. Fuzzy Logic, belief theory, • Data driven • Statistical • Relies on statistical analysis to determine relevant spatial associations of various geological, geophysical or geochemical elements with known ore deposits • e.g. Weights of Evidence, Neural Networks
Knowledge Driven Process • ConceptualDeposit Model • All observations arounddepositavailable in regional data sets • Guides final choice of data sets • Building a Database • Interpolation and extrapolation • Data Processing • Map reclassification • Proximitymaps • Compress via Principal Component Analysis • Filters • MapCombination
Principal Elements • (1) Exploration dataset. Here we refer to digital datasets, such as digitized geological maps, geophysical images, geochemical survey data and remotely sensed images, frequently employed by exploration geologists in the mineral exploration process. • (2) Exploration model. There are a large number of deposit models that have been defined for the various mineral deposit types, based on deposit characteristics. Deposit models help to classify and identify new occurrences, lead to an improved understanding of how the deposits formed, and act as an aid to exploration • (3) Training points. This is a point layer consisting of the locations at which the point objects are known to occur. • (4) Response theme. This is an output map that expresses the probability that a unit area contains a point, estimated by combining the weights of the predictor variables (evidential themes).
Example, Iran A Predictive GIS Model For Potential Mapping of Gold and Base Metal Mineralization In Takab Area, Iran H. Asadi Haroni & Martin Hale International Institute For Aerospace Survey and Earth Sciences (ITC), Netherlands Map A: Zagros orogenic belt of Iran. MapB: the spatial distribution of mineral occurrences with the Tertiary volcano-plutonic rocks of NW Iran
map Cu Quaternary Sediment Tertiary Sediment Tertiary Volcano-Plutonic Rocks Pb/Zn Au/As Sb Upper Paleozoic- Metamorphosed Ophiolitic rocks Pb/Zn Au Precambrian Marble 5 km Precambrian Mica-schist, Amphibolite and gneiss Geological and Mineral Occurrence Map of Takab Area, Iran
Deposit recognition criteria 1) Host rock lithology: a) Precambrian balck shale and carbonates, b) Highly fractured Oligo-Miocene calcareous shale, karsted limestone and ferruginous carbonates 2) Associated Oligo-Miocene igneous rocks (surface and subsurface) 3) Hydrothermal alteration (argellic and iron oxides) 4) Structures (faults, anticlines)
Weights of evidence method N= area M=Number of occurrences t=total d=subarea N t = 5000, 100% Nd = 500 or 10 % Nt - Nd = 4500 or 90% Mt = 20, 100% Md= 10, 50% Baysian Weights of Evidence Probability Analysis Positive Spatial % min. occurrences in Dm Association if 1 > % of total area occupied by Dm Dm Negative Spatial % min. occurrences in Dm Association if 1 < % of total area occupied by Dm No Spatial % min. occurrences in Dm Association if 1 = % of total area occupied by Dm 0 . 50 / 0 . 10 = 5 0 . 50 / 0 . 90 = 0 . 55 W+ = ln 5 = + 1.6 W+ = ln 0 . 55 = -0.6
Data Driven Neural Networks A neural network is an algorithm with some of the learning characteristics of a biological brain. Our brains take the experiences of our five senses and draw conclusions that help us cope with our changeable world. In more practical terms neural networks are non-linear statistical data modeling or decision making tools. They can be used to model complex relationships between inputs and outputs or to find patterns in data.
Soil contamination imposes limitations on several types of land use, especially agricultural and residential areas. Construction in contaminated areas requires the critical consideration of precautionary measures and reliable means and locations to remove and store the contaminated soils. The prediction of soil contamination contributes considerably to meaningful land use planning in affected areas.
Figure 2: Consideration of influencing factors - Mineralized ore veins Training points - Arsenic content in soils
Neural Network Inverse Distance