Download
1 / 1
10 likes | 131 Views
Regression analysis for clinical scores of Alzheimer’s Disease using multivariate machine learning method Carlton Chu 1 ;Stefan Klöppel 1,2 ; Cynthia Stonnington 1,3 ;; Bogdan Draganski 1 ; Clifford Jack 3 ; John Ashburner 1 and Richard S.J. Frackowiak 1,4,5

E N D
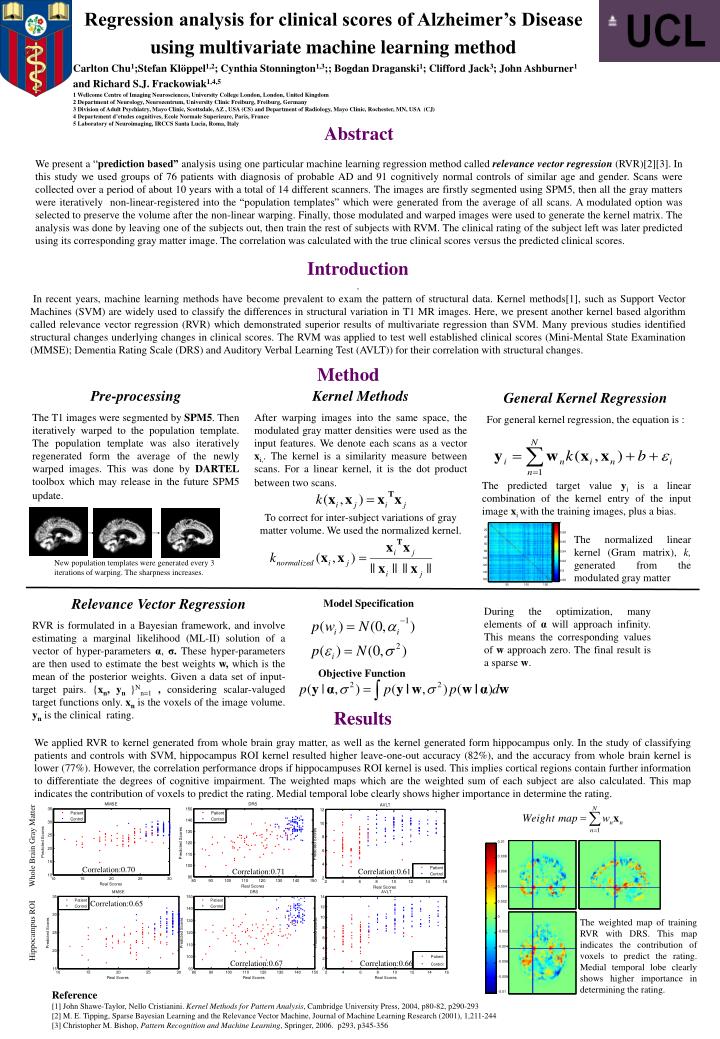
Regression analysis for clinical scores of Alzheimer’s Disease using multivariate machine learning method Carlton Chu1;Stefan Klöppel1,2; Cynthia Stonnington1,3;; Bogdan Draganski1; Clifford Jack3; John Ashburner1 and Richard S.J. Frackowiak1,4,5 1 Wellcome Centre of Imaging Neurosciences, University College London, London, United Kingdom 2 Department of Neurology, Neurozentrum, University Clinic Freiburg, Freiburg, Germany 3 Division of Adult Psychiatry, Mayo Clinic, Scottsdale, AZ , USA (CS) and Department of Radiology, Mayo Clinic, Rochester, MN, USA (CJ) 4 Departement d’etudes cognitives, Ecole Normale Superieure, Paris, France 5 Laboratory of Neuroimaging, IRCCS Santa Lucia, Roma, Italy 0.01 0.008 0.006 0.004 0.002 0 -0.002 -0.004 -0.006 -0.008 -0.01 Abstract We present a “prediction based” analysis using one particular machine learning regression method called relevance vector regression (RVR)[2][3]. In this study we used groups of 76 patients with diagnosis of probable AD and 91 cognitively normal controls of similar age and gender. Scans were collected over a period of about 10 years with a total of 14 different scanners. The images are firstly segmented using SPM5, then all the gray matters were iteratively non-linear-registered into the “population templates” which were generated from the average of all scans. A modulated option was selected to preserve the volume after the non-linear warping. Finally, those modulated and warped images were used to generate the kernel matrix. The analysis was done by leaving one of the subjects out, then train the rest of subjects with RVM. The clinical rating of the subject left was later predicted using its corresponding gray matter image. The correlation was calculated with the true clinical scores versus the predicted clinical scores. Introduction . In recent years, machine learning methods have become prevalent to exam the pattern of structural data. Kernel methods[1], such as Support Vector Machines (SVM) are widely used to classify the differences in structural variation in T1 MR images. Here, we present another kernel based algorithm called relevance vector regression (RVR) which demonstrated superior results of multivariate regression than SVM. Many previous studies identified structural changes underlying changes in clinical scores. The RVM was applied to test well established clinical scores (Mini-Mental State Examination (MMSE); Dementia Rating Scale (DRS) and Auditory Verbal Learning Test (AVLT)) for their correlation with structural changes. Method Pre-processing The T1 images were segmented by SPM5. Then iteratively warped to the population template. The population template was also iteratively regenerated form the average of the newly warped images. This was done by DARTEL toolbox which may release in the future SPM5 update. Kernel Methods After warping images into the same space, the modulated gray matter densities were used as the input features. We denote each scans as a vector xi,. The kernel is a similarity measure between scans. For a linear kernel, it is the dot product between two scans. General Kernel Regression For general kernel regression, the equation is : The predicted target value yi is a linear combination of the kernel entry of the input image xi with the training images, plus a bias. To correct for inter-subject variations of gray matter volume. We used the normalized kernel. The normalized linear kernel (Gram matrix), k, generated from themodulated gray matter New population templates were generated every 3 iterations of warping. The sharpness increases. Relevance Vector Regression RVR is formulated in a Bayesian framework, and involve estimating a marginal likelihood (ML-II) solution of a vector of hyper-parameters α, σ. These hyper-parameters are then used to estimate the best weights w, which is the mean of the posterior weights. Given a data set of input-target pairs. {xn,yn }Nn=1, considering scalar-valuged target functions only. xn is the voxels of the image volume. yn is the clinical rating. Model Specification During the optimization, many elements of αwill approach infinity. This means the corresponding values of w approach zero. The final result is a sparse w. Objective Function Results We applied RVR to kernel generated from whole brain gray matter, as well as the kernel generated form hippocampus only. In the study of classifying patients and controls with SVM, hippocampus ROI kernel resulted higher leave-one-out accuracy (82%), and the accuracy from whole brain kernel is lower (77%). However, the correlation performance drops if hippocampuses ROI kernel is used. This implies cortical regions contain further information to differentiate the degrees of cognitive impairment. The weighted maps which are the weighted sum of each subject are also calculated. This map indicates the contribution of voxels to predict the rating. Medial temporal lobe clearly shows higher importance in determine the rating. Whole Brain Gray Matter Correlation:0.70 Correlation:0.71 Correlation:0.61 Correlation:0.65 The weighted map of training RVR with DRS. This map indicates the contribution of voxels to predict the rating. Medial temporal lobe clearly shows higher importance in determining the rating. Hippocampus ROI Correlation:0.67 Correlation:0.66 Reference [1] John Shawe-Taylor, Nello Cristianini. Kernel Methods for Pattern Analysis, Cambridge University Press, 2004, p80-82, p290-293 [2] M. E. Tipping, Sparse Bayesian Learning and the Relevance Vector Machine, Journal of Machine Learning Research (2001), 1,211-244 [3] Christopher M. Bishop, Pattern Recognition and Machine Learning, Springer, 2006. p293, p345-356