Download
1 / 40
420 likes | 535 Views
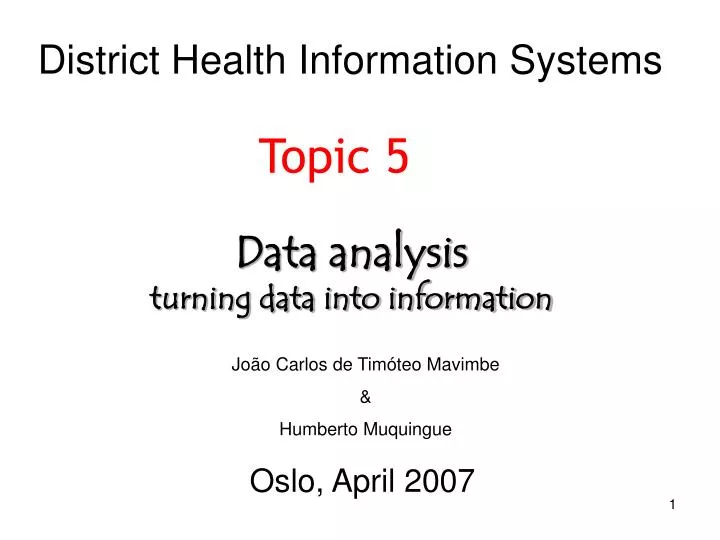
District Health Information Systems. Topic 5. Data analysis turning data into information. Oslo, April 2007. João Carlos de Timóteo Mavimbe & Humberto Muquingue. Presenting Interpreting. Indicators. ANALYSIS Processing. USE. Collection. Input Raw data. LEARNING OUTCOMES.

E N D
District Health Information Systems Topic 5 Data analysisturning data into information Oslo, April 2007 João Carlos de Timóteo Mavimbe & Humberto Muquingue
Presenting Interpreting Indicators ANALYSIS Processing USE Collection Input Raw data
LEARNING OUTCOMES • By the end of this session, you should be able to: • Explain how data is converted into information • Explain basic epidemiological terms and concepts • Explain concepts of numerator and denominator • Explain the meaning and use of terms: count, rate, ratio and proportion • Make simple calculations
Data analysiswhat, why and how? • WHAT ? (meaning) • turns raw data into useful information • is the process of producing indicators – most important step in data analysis • uses quality data – with the 3 C’s
Data analysiswhat, why and how? • WHY ? (purpose) • the aim of a DHIS - the improvement of coverage and quality of local health services - is facilitated by only collecting data that can be analyzed and used at the local level • allows comparisons – facilities / teams • favors self assessment (have I reached my target ?) • supports decision-making
Data analysiswhat, why and how? • HOW ? (use) • calculates indicators • uses basic epidemiological concepts Can you provide examples?
Occram’s rule Indicators - many definitions • variables that help to measure changes, directly or indirectly (WHO, 1981) • indirect measures of an event or condition (Wilson and Sapanuchart, 1993) • variables that indicate or show a given situation and thus can be used to measure change (Green, 1992)
Indicators • measures of COVERAGE and QUALITY • variables used to measure CHANGE: • monitor progress towards defined targets • describe situations • measure trends over time • provide a yardstick whereby facilities / teams cancompare themselves to others
Indicators – there are many calculation types 1. “Count” – no denominator numerator - number of events, observations, individuals (frequency) 2. “Proportion” – numerator is part of denominator expressed as per 100 (%), 1000, 10 000, 100 000 3. “Ratio” – numerator is not part of denominatorcomparing 2 different numerators 4. “Rate” – a detailed proportion number of events during a specific period
5. “Aggregated, composite or indexed indicators” • - DALY (disability-adjusted life years) • HALE (health-adjusted life expectancy) • QALE (quality-adjusted life years)
There are about 1,500 indicators in the health sector (World Bank inventory)!
An ideal indicator RAVES !!!
An ideal indicator RAVES • RELIABLE it gives the same result if used by different people • APPROPRIATE it is the best way of measuring what we want to know • VALID it measures what you want to measure • EASY it is feasible to collect the data to produce this indicator (KISS) • SENSITIVE, SPECIFIC it reflects changes in events being measured
Atop the line – numerators(activities / interventions / events / observations / people) • a count of the event being measured • How many occurrences are there: • morbidity (health problem, disease) • mortality (death) • resources (humanpower, money, materials) • Generally raw data (numbers)
Under the line - denominators(population at risk) • size of target population at risk of the event • What group do they belong to: • general population (total, catchment, target) • gender population (male / female) • age group population (<1, >18, 15-44) • cases / events – per (live births, TB case)
I. Systems classification • INPUT • monitors affordability of resources • measures availability / quality of resources • PROCESS • monitors activities that are carried out • measures accessibility of services – coverage and quality • OUTPUT • monitors results of activities • measures acceptability - use, change, performance, coverage and quality • OUTCOME • monitors changes in health status of populations IMPACT • measures appropriateness - effectiveness, efficiency, equity, sustainability
II. Functional classification • Indicators can be grouped according to their function in plannning and monitoring: • Health status • Activities • Quality • Resources • Output / Efficiency • Efficacy • Impact / Outcome
A. Health status indicators • They inform about the causes of disease and death in a given population. • Examples: • Morbility rates of measles • Death rates of TB • Incidence rates of diarrhea • Low birth weight rates
B. Activity indicators • They inform about of volumes of work. • Examples: • Coverage rates of a programme • Achievement indexes • Use of services (OPD utilisation rates) • Admission rates per inhabitant
C. Quality indicators • They inform about the excellence of activities carried out. • Examples: • Antenatal attendance rates • Direct obstetric death rates in the facility • Vaccine dropout rates
D. Resource indicators • They inform about the availability / quality of consummables, equipments, staff, health facilities and money. • Examples: • Cost of drugs prescribed per consultation • Number of inhabitants per clinical officer • Percentage of health facilities with vehicle for programme activities • Availability of vital drugs
E. Efficiency indicators • They refer to the volume of activities performed using a given resource. They inform whether the resources were well used, underused or overusedthe ratio of inputs needed per unit of output produced • Examples: • Deliveries per nurse • Bed occupancy rates • Average length of stay
F. Output or efficacy indicators • They show to what extent the expected result was attained with the available resources “the degree to which outputs affect outcomes and impacts” • Examples: • Reported new cases of acute flaccid paralysis • Incidence rates of EPI-targeted diseases • Percentage of fully immunised children
G. Impact or outcome indicators • The impact of a programme is the effect that programme induced on the overall health status and socio-economic conditions of the target population • Examples: • Nutritional status of children • Percentage of new family planning acceptors • Incidence and mortality rates due to HIV • Infant mortality rates
III. Classification according to indicator level • Local indicators • Indicators from censuses and surveys
1. Local indicators • Compiled from routine HMIS data • Should follow principles of “minimum data set” and “information filter”
Minimum or Essential Dataset ► the minimum amount of data that needs to be collected ► for the effective management of services which allows them to make the greatest impact on the health needs of the community which they serve (thus improving coverage and quality) ► uses minimum number of data collection tools
Community Information Systems Indicators, procedures and datasets: District Information Systems Provincial Information Systems Community District National Information Systems Province International IS National International The Information filter
2. Indicators from censuses and surveys • Infant mortality rate • Crude death rates • Crude birth rate • Death rates of children aged 0-4 years • Maternal mortality rates • Seroprevalence of HIV or BHep
Epidemiology:what, why and how? WHAT ? (meaning) study of the distribution, frequency and determinants of health problems and disease in human populations WHY ? (purpose) obtain, interpret and use health information to promote health and reduce disease HOW ? (outcome) uses indicators to answer basic epidemiological questions
Information cycle meets Planning cycle
StagesToolsOutputs Information Cycle Decision-making for effective management What do we collect? data sources & tools Good quality data What do we do with it? How do we use it? Quality at every stage EDS Interpretation of information analysis Data converted to information feedback How do we present it? Reports and graphs
Stages ToolsOutputs Planning Cycle Where are we now? Situation analysis Review of plans Priority problems How will we know when we arrive? Monitoring and Evaluation Where are we going? Goals, Targets, Indicators Quality information at every stage EDS Key interventions Key strategies How will we get there? Action Plans
GOALS • broad policies and long term objectives • broad aims stated in general terms • represent future direction • Set at national level by political and health decision makers • general objectives (aims, long term objectives) • correlated with local context • set at provincial and district levels by health managers
TARGETS • they are a subset of objectives • state exactly what has to be achieved, by whom and by when • a realistic point at which to aim to reach a goal • turning the goal into number terms
TARGETS should be SMART • Specific measurable based on changes in situation concerned • Measurable able to be easily quantified • Appropriate fit in to local needs, capacities and culture • Realistic can be reached with available resources • Time bound to be achieved by a certain time