Download
1 / 1
10 likes | 128 Views
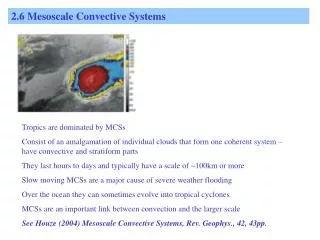
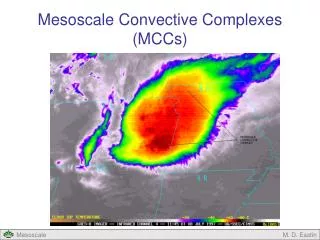
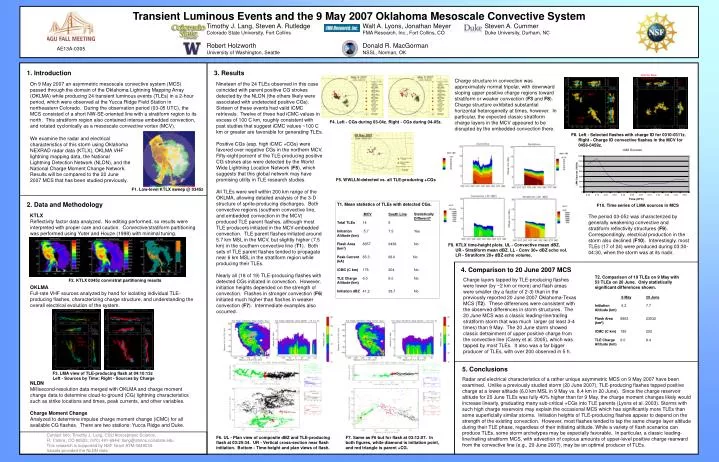
Transient Luminous Events and the 9 May 2007 Oklahoma Mesoscale Convective System. Timothy J. Lang, Steven A. Rutledge Colorado State University, Fort Collins Robert Holzworth University of Washington, Seattle. Walt A. Lyons, Jonathan Meyer FMA Research, Inc., Fort Collins, CO

E N D
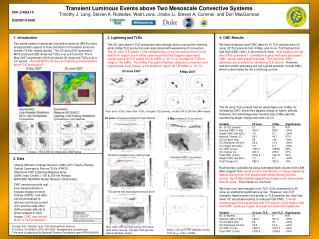
Transient Luminous Events and the 9 May 2007 Oklahoma Mesoscale Convective System Timothy J. Lang, Steven A. Rutledge Colorado State University, Fort Collins Robert Holzworth University of Washington, Seattle Walt A. Lyons, Jonathan Meyer FMA Research, Inc., Fort Collins, CO Donald R. MacGorman NSSL, Norman, OK Steven A. Cummer Duke University, Durham, NC AE13A-0305 1. Introduction 3. Results Intense New Convection Charge structure in convection was approximately normal tripolar, with downward sloping upper positive charge regions toward stratiform or weaker convection (F3 and F8). Charge structure exhibited substantial horizontal heterogeneity at times, however. In particular, the expected classic stratiform charge layers in the MCV appeared to be disrupted by the embedded convection there. On 9 May 2007 an asymmetric mesoscale convective system (MCS) passed through the domain of the Oklahoma Lightning Mapping Array (OKLMA) while producing 24 transient luminous events (TLEs) in a 2-hour period, which were observed at the Yucca Ridge Field Station in northeastern Colorado. During the observation period (03-05 UTC), the MCS consisted of a short NW-SE-oriented line with a stratiform region to its north. This stratiform region also contained intense embedded convection, and rotated cyclonically as a mesoscale convective vortex (MCV). Nineteen of the 24 TLEs observed in this case coincided with parent positive CG strokes detected by the NLDN (the others likely were associated with undetected positive CGs). Sixteen of these events had valid iCMC retrievals. Twelve of these had iCMC values in excess of 100 C km, roughly consistent with past studies that suggest iCMC values ~100 C km or greater are favorable for generating TLEs. Positive CGs (esp. high iCMC +CGs) were favored over negative CGs in the northern MCV. Fifty-eight percent of the TLE-producing positive CG strokes also were detected by the World Wide Lightning Location Network (F5), which suggests that this global network may have promising utility in TLE research studies. All TLEs were well within 200 km range of the OKLMA, allowing detailed analysis of the 3-D structure of sprite-producing discharges. Both convective regions (southern convective line, and embedded convection in the MCV) produced TLE parent flashes, although most TLE producers initiated in the MCV-embedded convection. TLE parent flashes initiated around 5.7 km MSL in the MCV, but slightly higher (7.5 km) in the southern convective line (T1). Both sets of TLE parent flashes tended to propagate near 6 km MSL in the stratiform region while producing their TLEs. Nearly all (18 of 19) TLE-producing flashes with detected CGs initiated in convection. However, initiation heights depended on the strength of convection. Flashes in stronger convection (F6) initiated much higher than flashes in weaker convection (F7). Intermediate examples also occurred. MCV South Line F4. Left - CGs during 03-04z. Right - CGs during 04-05z. F8. Left - Selected flashes with charge ID for 0310-0311z. Right - Charge ID convective flashes in the MCV for 0458-0459z. We examine the radar and electrical characteristics of this storm using Oklahoma NEXRAD radar data (KTLX), OKLMA VHF lightning mapping data, the National Lightning Detection Network (NLDN), and the National Charge Moment Change Network. Results will be compared to the 20 June 2007 MCS that has been studied previously. F5. WWLLN-detected vs. all TLE-producing +CGs F1. Low-level KTLX sweep @ 0345z 2. Data and Methodology T1. Mean statistics of TLEs with detected CGs. MCVSouth Line Statistically Different? Total TLEs 145 Initiation 5.7 7.5 Yes Altitude (km) Flash Area 8657 9438 No (km2) Peak Current 65.3 68.0 No (kA) iCMC (C km) 176 204 No TLE Charge 6.0 6.0 No Altitude(km) Initiation dBZ 41.2 38.7 No F10. Time series of LMA sources in MCS KTLX Reflectivity factor data analyzed. No editing performed, so results were interpreted with proper care and caution. Convective/stratiform partitioning was performed using Yuter and Houze (1998) with minimal tuning. OKLMA Full-rate VHF sources analyzed by hand for isolating individual TLE-producing flashes, characterizing charge structure, and understanding the overall electrical evolution of the system. NLDN Millisecond-resolution data merged with OKLMA and charge moment change data to determine cloud-to-ground (CG) lightning characteristics such as strike locations and times, peak currents, and other variables. Charge Moment Change Analyzed to determine impulse charge moment change (iCMC) for all available CG flashes. There are two stations: Yucca Ridge and Duke. The period 03-05z was characterized by generally weakening convective and stratiform reflectivity structures (F9). Correspondingly, electrical production in the storm also declined (F10). Interestingly, most TLEs (17 of 24) were produced during 03:30-04:30, when the storm was at its nadir. F9. KTLX time-height plots. UL - Convective mean dBZ. UR - Stratiform mean dBZ. LL - Conv 30+ dBZ echo vol. LR - Stratiform 20+ dBZ echo volume. 4. Comparison to 20 June 2007 MCS T2. Comparison of 19 TLEs on 9 May with 53 TLEs on 20 June. Only statistically significant differences shown. 9 May20 June Initiation 6.2 7.7 Altitude (km) Flash Area 8863 23532 (km2) iCMC (C km) 185 292 TLE Charge 6.0 8.4 Altitude(km) Charge layers tapped by TLE-producing flashes were lower (by ~2 km or more) and flash areas were smaller (by a factor of 2-3) than in the previously reported 20 June 2007 Oklahoma-Texas MCS (T2). These differences were consistent with the observed differences in storm structures. The 20 June MCS was a classic leading-line/trailing stratiform storm that was much larger (at least 3-4 times) than 9 May. The 20 June storm showed classic detrainment of upper positive charge from the convective line (Carey et al. 2005), which was tapped by most TLEs. It also was a far bigger producer of TLEs, with over 200 observed in 5 h. F2. KTLX 0345z conv/strat partitioning results TLE Parent +CG 5. Conclusions F3. LMA view of TLE-producing flash at 04:10:13z Left - Sources by Time; Right - Sources by Charge Radar and electrical characteristics of a rather unique asymmetric MCS on 9 May 2007 have been examined. Unlike a previously studied storm (20 June 2007), TLE-producing flashes tapped positive charge at a lower altitude (6.0 km MSL in 9 May vs. 8.4 km in 20 June). Since the charge reservoir altitude for 20 June TLEs was fully 40% higher than for 9 May, the charge moment changes likely would increase linearly, graduating many sub-critical +CGs into TLE parents (Lyons et al. 2003). Storms with such high charge reservoirs may explain the occasional MCS which has significantly more TLEs than some superficially similar storms. Initiation heights of TLE-producing flashes appear to depend on the strength of the existing convection. However, most flashes tended to tap the same charge layer altitude during their TLE phase, regardless of their initiating altitude. While a variety of flash scenarios can produce TLEs, some storm archetypes may be especially favorable. In particular, a classic leading-line/trailing stratiform MCS, with advection of copious amounts of upper-level positive charge rearward from the convective line (e.g., 20 June 2007), may be an optimal producer of TLEs. Contact Info: Timothy J. Lang, CSU Atmospheric Science, Ft. Collins, CO 80523; (970) 491-6944; tlang@atmos.colostate.edu This research is supported by NSF Grant ATM-0649034. Vaisala provided the NLDN data. F6. UL - Plan view of composite dBZ and TLE-producing flash at 03:25:34. UR - Vertical cross-section near flash initiation. Bottom - Time-height and plan views of flash. F7. Same as F6 but for flash at 03:12:07. In both figures, white diamond is initiation point, and red triangle is parent +CG.