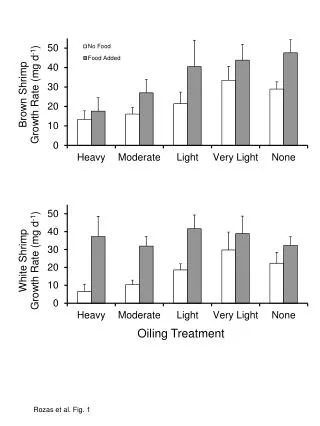
Download
1 / 5
50 likes | 176 Views
SUPPLEMENTAL DATA. Imamura et al. Fig. S1A. Imamura et al. Fig. S1B. Imamura et al. Fig. S1C.

E N D
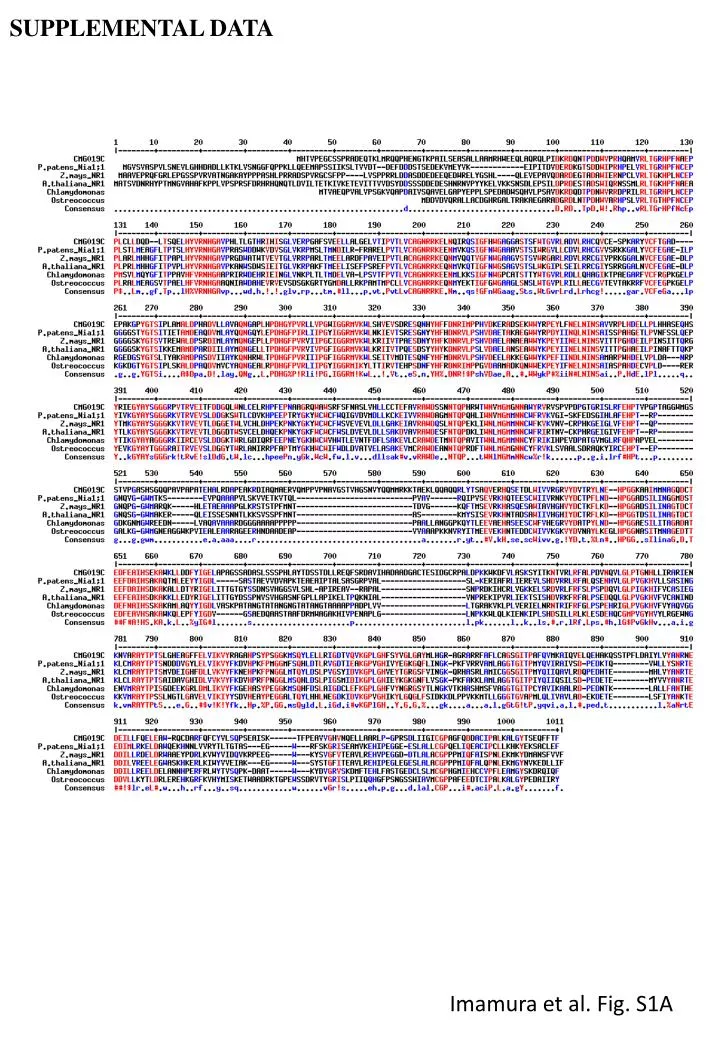
SUPPLEMENTAL DATA Imamura et al. Fig. S1A
Figure S1. Comparison of nitrate assimilation-related proteins of C. merolae with homologous proteins from other organisms. The predicted amino acid sequences of CMG019C (A), CMG018C (B) and CMG021C/CMJ117C (C) were compared with NR, NRT and NiR/SiR proteins, respectively, by multiple alignments. Compared proteins were CMG019C, Nia1;1 of Physcomitrella patens (BAE17052), NR1 of Zea mays (AAD38068), NR1 of Arabidopsis thaliana (AAG51627), putative NR of Ostreococcuslucimarinus CCE9901 (ABO98391), and NIT1 of Chlamydomonas reinhardtii (AAF17595) in A, CMG018C, NRT2;3 of P. patens (BAD00099), Nat of Skeletonemacostatum (AAL85928), Nitrate/nitrite transporter of Leptospira biflexa (ABZ95168), putative NRT of Cytophaga hutchinsonii (YP_677931), MAE1.2 of A. thaliana (BAB10098), and nrt2.2 of Z. mays (AAV73917) in B, and CMG018C, CMJ117C, SiR and NiR of Anabaene sp. PCC 7120 (CyanoBase, http://bacteria.kazusa.or.jp/cyanobase/), SiR and NiR of Nicotiana tabacum (BAA33531 and BAD15365), SiR and NiR of Arabidopsis thaliana (CAA89154 and BAA21672), SiR of Escherichia coli (AP_003330), and NirA of L. boryana (D31732) in C. The multiple alignments were constructed using the MultAlin homepage (http://bioinfo.genopole-toulouse.prd.fr/multalin/multalin.html), where red and blue colors indicate high (>90%) and low (>50%) consensus values. !, $, %, and # symbols in the consensus lines show (I or V), (L or M), (F or Y), and (N, D, Q or E), respectively.
URACm-Gs URA5Cm URA3Gs 1-kb Figure S2. Schematic representation of URACm-Gs gene marker. Black line, white box, and gray arrow indicate upstream region of C. merolae URA5.3 (903-bp), C. merolae URA5 region (512-bp), and G. sulphurariaURA3 region (URA3Gs, 904-bp), respectively.See MATERIALS AND METHODSfor a detailed description. Imamura et al. Fig. S2