Download
1 / 9
90 likes | 177 Views
iWarp Based Remote Interactive Scientific Visualization CENIC 2008 Oakland, CA. Scott A. Friedman UCLA Academic Technology Services Research Computing Technologies Group. Our Challenge. Applications which make use of 10 gigabit network infrastructure iWarp, leveraging our existing IB code

E N D
iWarp Based Remote Interactive Scientific VisualizationCENIC 2008Oakland, CA Scott A. Friedman UCLA Academic Technology Services Research Computing Technologies Group
Our Challenge • Applications which make use of • 10 gigabit network infrastructure • iWarp, leveraging our existing IB code • Extend access to our visualization cluster • Remote sites around UCLA campus • Remote sites around UC system • Remote sites beyond… CENIC 08
Our Visualization Cluster • Hydra - Infiniband based • 24 rendering nodes (2x nvidia G70) • 1 high definition display node • 3 visualization center projection nodes • 1 remote visualization bridge node • Research System - primarily • High performance interactive rendering (60Hz) • Load balanced rendering • Spatio-temporal data exploration and discovery • System requires both low latency and high bandwidth CENIC 08
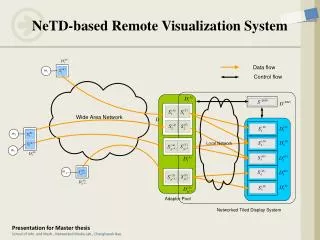
Remote Visualization Bridge Node • Bridges from IB to iWarp/10G ethernet • Appears like a display to cluster • No change to existing rendering system • Pixel data arrives over IB, which • is sent over iWarp to a remote display node • uses same RDMA protocol • Same buffer used for receives and sends • Very simple in principle - sort of… • is pipelined along the entire path • pipeline chunk size is optimized offline CENIC 08
Simple Diagram scinet remote HD node iWarp nlr local HD node input IB pixel data cenic visualization cluster Acts like a display to the cluster ucla bridge node IB iWarp CENIC 08
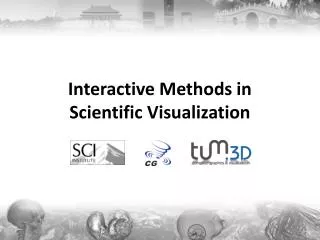
What are we transmitting • High definition uncompressed ‘video’ stream • 60Hz at 1920x1080 ~ 396MB/s (3Gbps) • One frame every 16.6ms • Achieved three simultaneous streams at UCLA • Using a single bridge node • Just over 9.2Gbps over campus backbone • Actual visualization • Demo is a particle DLA simulation • Diffusion limited aggregation - physical chemistry • N-body simulations CENIC 08
Diffusion limited aggregation CENIC 08
Continuing Work • Local latency is manageable • ~60usec around campus • Longer latencies / distances • UCLA to UC Davis ~20ms rtt (CENIC) • UCLA to SC07 (Reno, NV) ~14ms rtt (CENIC/NLR) • How much can we tolerate - factor of interactivity • Jitter can be an issue, difficult to buffer, typically just toss data • Challenges • Proper application data pipelining helps hide latency • Buffering is not really an option due to interaction • Packet loss is a killer - some kind of provisioning desired/needed • Remote DMA is not amenable to unreliable transmission • Reliable hybrid application protocol likely best solution CENIC 08
Thank you • UCLA • Mike Van Norman, Chris Thomas • UC Davis • Rodger Hess, Kevin Kawaguchi • SDSC • Tom Hutton, Matt Kullberg, Susan Rathburn • CENIC • Chris Costa • Open Grid Computing, Chelsio • Steve Wise, Felix Marti CENIC 08