Download
1 / 12
140 likes | 361 Views

E N D
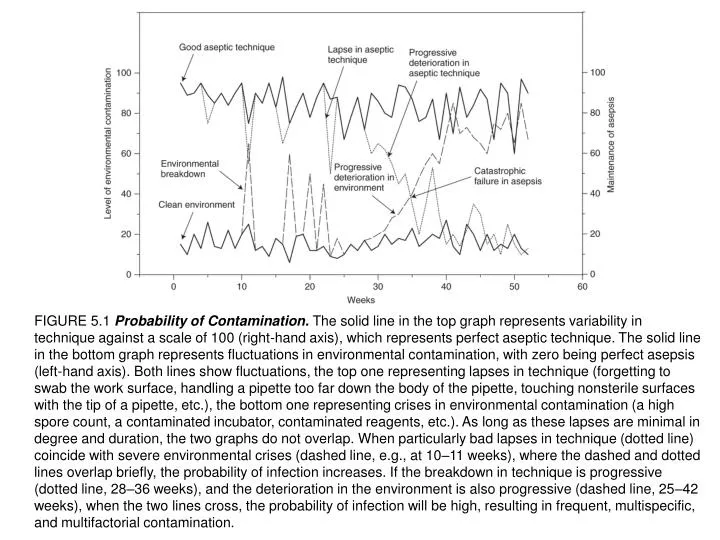
FIGURE 5.1 Probability of Contamination. The solid line in the top graph represents variability in technique against a scale of 100 (right-hand axis), which represents perfect aseptic technique. The solid line in the bottom graph represents fluctuations in environmental contamination, with zero being perfect asepsis (left-hand axis). Both lines show fluctuations, the top one representing lapses in technique (forgetting to swab the work surface, handling a pipette too far down the body of the pipette, touching nonsterile surfaces with the tip of a pipette, etc.), the bottom one representing crises in environmental contamination (a high spore count, a contaminated incubator, contaminated reagents, etc.). As long as these lapses are minimal in degree and duration, the two graphs do not overlap. When particularly bad lapses in technique (dotted line) coincide with severe environmental crises (dashed line, e.g., at 10–11 weeks), where the dashed and dotted lines overlap briefly, the probability of infection increases. If the breakdown in technique is progressive (dotted line, 28–36 weeks), and the deterioration in the environment is also progressive (dashed line, 25–42 weeks), when the two lines cross, the probability of infection will be high, resulting in frequent, multispecific, and multifactorial contamination.
FIGURE 5.2 Tissue Culture Work Area. These photographs show how the layout of a tissue culture area has changed over the years. (a) One of Alexis Carrel’s culture rooms in Rockefeller Institute in the 1930s [from Parker, 1938]. (b) Glass-topped table as used in John Paul’s tissue culture room in the University of Glasgow Biochemistry Department in 1961. (c) Laminar-flow hood in use in Beatson Institute, Glasgow, in 1996.
FIGURE 5.3 Airflow in Laminar-Flow Hoods. Arrows denote direction of airflow. (a) Horizontal flow. (b) Vertical flow.
FIGURE 5.4 Layout of Work Area. (a) Laminar-flow hood laid out correctly with pipettes on the left at the back, propped up for easy access and to allow airflow to the rear grill, medium to the left of the work area, culture flasks central and well back from the front edge, and pipette controller on the right. Positions may be reversed for left-handed workers. (b) Laminar-flow hood being used incorrectly. The hood is too full, and many items encroach on the air intake at the front, destroying the laminar airflow and compromising both containment and sterility.
FIGURE 5.5 Layout of Horizontal Laminar-Flow Hood. Correct layout for working in a horizontal laminar-flow hood. Positions may be reversed for left-handed workers.
FIGURE 5.6 Layout of Work Area on Open Bench. Items are arranged in a crescent around the clear work space in the center. The Bunsen burner is located centrally, to be close by for flaming and to create an updraft over the work area.
FIGURE 5.7 Holding Cap and Bulb. Cap may be unscrewed and held in the crook of the little finger of the hand holding the bulb or pipette controller.
FIGURE 5.8 Waste Beaker. Filter funnel prevents contents of beaker from splashing back.
FIGURE 5.9 Inserting a Pipette in a Pipette Controller. Pipette being inserted correctly with grip high on the pipette (above the graduations) and the pipette pointing away from the user. Circled areas mark potential risks, namely inadvertently touching the bottle or the back of the cabinet.
FIGURE 5.10 Tilting Flasks. The air space inside a flask expands in the incubator or warm room. In large flasks, this causes the flask to bulge and will tilt the flasks, increasing the tilt with the height of the stack.
FIGURE 5.11 Boxed Dishes. A transparent box, such as a sandwich box or cake box, helps protect unsealed dishes and plates, and flasks with slackened caps, from contamination in a humid incubator. This type of container should also be used for materials that may be biohazardous, to help contain spillage in the event of an accident. (Material known to be biohazardous would need a sealed container and a separate incubator.)
FIGURE 5.12 Gassing a Flask. A pipette is inserted into the supply line from the CO2 source, and 5% CO2 is used to flush the air out of the flask without bubbling through the medium. The letter ‘‘F’’ indicates a micropore filter inserted in the CO2 line.