Download
1 / 24
240 likes | 450 Views
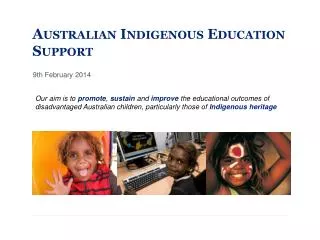
Patterns of Health and Illness in Indigenous Australian Communities. Dr Ross Bailie Associate Professor in Public Health. Menzies School of Health Research. Flinders NT Clinical School. Ph 08-89228835 or 08-89228196 Fax 08-89275187 email: ross.bailie@menzies.edu.au. Learning Objectives.

E N D
Patterns of Healthand Illness in Indigenous Australian Communities Dr Ross Bailie Associate Professor in Public Health Menzies School of Health Research Flinders NT Clinical School Ph 08-89228835 or 08-89228196 Fax 08-89275187 email: ross.bailie@menzies.edu.au
Learning Objectives Patterns of morbidity and mortalityUnderlying determinants
Performance Objectives To use your understanding of patterns and determinants of health and illness in your everyday practice with Indigenous people
Sources of Information and Acknowledgements • Australian Indigenous Health Infonet web site
Definition of Indigenous status • An Aboriginal or Torres Strait Islander is a person of Aboriginal or Torres Strait Islander descent who identifies as Aboriginal or Torres Strait islander and is accepted as such by the community in which he or she is associated. (Barnes, White, & Ross 1997) http://www.healthinfonet.ecu.edu.au/html/html_keyfacts/keyfacts_faq.htm
Population distribution • Total estimated Indigenous population~418,800-476,900(projection for June 2000 based on the 1996 census) • 2.2-2.5% of the total Australian population http://www.healthinfonet.ecu.edu.au/html/html_keyfacts/keyfacts_faq.htm
Age group Non-Indigenous Indigenous Percentage of population
Population distribution(continued) • Age distribution related to patterns of health and illness • Age distribution typical of a developing country population • Chronic diseases occur at a relatively young age
Standardised Mortality Ratios for selected causes of death, WA, SA, NT (1995-97) CAUSE OF DEATH Males Females Circulatory 2.9 2.5 Injuries 3.2 3.5 Respiratory 5.2 6.0 Cancer 1.4 1.4 Endocrine 6.1 12.0 Digestive 5.1 5.5 All causes 3.0 3.0
Infant mortality rates for the Indigenous and total populations, WA, SA, and the NT, 1996(infant deaths per 1000 live births) State/ Total Territory Indigenous Population Ratio WA 24.1 6.5 3.7 SA 12.6 4.9 2.6 NT 19.4 11.5 1.7
Morbidity • Respiratory disease • Injury • Cardiovascular disease • Diabetes • Renal disease
Morbidity(continued) • Metabolic syndrome • Communicable disease • Cancer
Births and pregnancy outcome • Fertility rates • Low birth weight
Trends • Widening disparity • Contrast with other countries
Determinants of Health Status • Colonial history • Education • Employment • Income • Housing
Determinants of Health Status(continued) • Relative and absolute disadvantage • Control
Education • Poor attendance, retention, and outcomes • Geographic variability
Percentage of NT students achieving national reading benchmarks in 1998(from Learning lessons - An independent review of Indigenous education in the Northern Territory) NT Student Group Year 3 Year 5 Non-Indigenous, Urban 82% 78% All students, Urban 78% 71% Indigenous, Urban 54% 36% Indigenous, Non-Urban 6% 4%
Links between health, education andsocio-economic status • Vicious cycle
Employment • Unemployment > 2 x higher • Pastoral industry • Racism • Education
Employment(continued) • Unskilled labour • CDEP
Income • Low paid jobs • Government payments
Housing and physical environment • Infrastructure • Urban/rural/remote disparity
Conclusion • Marked disparities in health status • Underlying determinants • Strategies