Download
1 / 41
410 likes | 426 Views
Implementing a Green Data Center. July 21, 2008 2:00pm EDT, 11:00am PDT George Spafford, Principal Consultant Pepperweed Consulting, LLC “Optimizing The Business Value of IT” http://www.pepperweed.com. Housekeeping. Submitting questions to speaker

E N D
Implementing a Green Data Center July 21, 2008 2:00pm EDT, 11:00am PDT George Spafford, Principal Consultant Pepperweed Consulting, LLC “Optimizing The Business Value of IT” http://www.pepperweed.com
Housekeeping Submitting questions to speaker Type question into small box in the Chat (Q&A) window on the left and click the arrow button. Questions will be answered during 10 minute Q&A session at end of webcast. Technical difficulties? Click on “Help” from top menu – select “Troubleshooting” to test system, get FAQ Or get tech support via Q&A tool
Agenda Background Need Objectives Meeting Demand Location Cooling Inside the Equipment Power Next Steps Continuous Improvement …and a lot of other things along the way Slides available by emailing: webcasts@jupitermedia.com Or George.Spafford@Pepperweed.com
Painting a Picture with Statistics Data centers consume 1.5% of all electricity in 2006 and growing at 12% annually – Department of Energy If IT were an industry, it would be approaching the top five energy consumers Data centers forecasted to surpass airlines in terms of CO2 emissions by 2020 due to energy consumed – McKinsey & Co. 2008 Can you say “Threat of regulation”? Data center power demands have doubled in last five years and 76% growth is predicted between 2005 and 2010 – IDC Three year cost of powering and cooling a typical server is now 1.5x the purchase cost of the hardware – Uptime Institute 2007 Energy costs are 15-20% of IT’s operating expenses – Dave Ohara, Microsoft 2007 50% of data centers will have insufficient power and cooling capacity by 2008 – Gartner 2006 70% of Global 1000 will need to significantly change their data centers in the next five years to meet current and future energy needs – Gartner 2007
What Are Your Objectives? Need to start by developing a plan Understand the organization’s overall direction with Green Need to understand current state Energy (our emphasis in this webcast) Cooling Other – eWaste, etc. Need to understand the future state Need to assemble a roadmap The roadmap must evolve over time Need monitoring to understand Progress against objectives Potential trends and opportunities for improvement
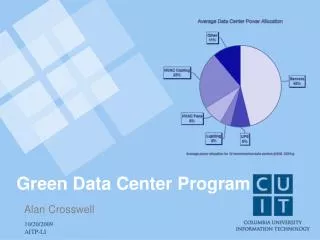
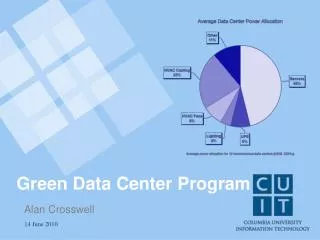
Power Consumption Chiller 33% IT Equipment 30% UPS 18% Computer Room Air Conditioning (CRAC) 9% Power DistributionUnits (PDUs) 5% Humidifiers 3% Switch / generator 1% Lighting 1% Notice how only 30% of each watt actually goes to the IT Equipment. Out of every 10 watts sent to the data center, only 3 wind up being used by IT equipment. 42% goes to cooling 24% goes to power 90% goes to the top four! http://www.thegreengrid.org/gg_content/Green_Grid_Guidelines_WP.pdf
Meeting Power and Cooling Demands Difficult to get 7+ year old data centers to support current and future power and cooling needs Designed for 2,500 KW/Rack Now seeing 20-30,000 KW/Rack w/high-density blades Designed for 35-70 watts per sq ft. Now 300+ watts. – Gartner (Provides a comparison, but don’t use square foot costs moving forward) That means that cooling requirements went up by 10-15x! Cooling based on watts per foot vs. localized zoning and other modern considerations Building has older and smaller wiring and power distribution Older inefficient CRACs, UPSes, PDUs, Chillers, Pumps, etc. Bottom line – it can be cost prohibitive to upgrade an existing data center Cheaper to build a new facility meeting requirements from the start Colocation in the short- or even long-term?
The Arrhenius Equation For every 10 degrees C, the rate of the reaction doubles For IT, for every 10C the rate of component failure doubles We know heat is bad so we cool the data center Results in hotspots – bad – see above Results in cold spots – bad – wasted energy Need the right level of cooling in the right place at the right time
Location Environment - Hot or cool? Cost of energy? Hawaii and Alaska are very expensive per kw hour Connecticut was 15.43 cents per kw hour (commercial rate) Idaho was 5.12 cents per kw hour for (commercial rate)1 Sufficiency of Power Avoiding roving black outs Google has a data center by the Dalles Dam in Oregon to avail of cheap reliable hydroelectric power Estimated in 2006 that Google had over 450,000 servers in 25 locations2 Opportunities for distributed / co-generation of power? Solar, geothermal, wind, etc. Virtualization the Data Center – what if the data center’s peak usage coincides with the locale’s lowest off-peak demand? Colocate in a third party data center • Analysis of electrical costs per state:http://www.spaffordconsulting.com/Cents%20per%20Kilowatt%20variation%20analysis_062208_v1d.xls • http://www.nytimes.com/2006/06/14/technology/14search.html?hp&ex=1150344000&en=25cfc1be85c1d603&ei=5094&partner=homepage
Cooling - Basics 1 watt of IT equipment requires 1 watt of cooling Studies report factors from 0.6 to 1.6 Color of roof and outside walls – want to reflect light not absorb Insulation – walls, ceiling, doors, windows and use door thresholds Limit access to the data center Temperature – Increase for 68 to 72 degrees F / 20 to 22 C Watt per square foot doesn’t work Averages ignore hot spots and cold spots May have been balanced when opened, doubtfully balanced after year one Cooling a 700 watt server is one thing a 30,000 watt blade system is another
Cooling – Moving Local Avoid loss of cooling capacity due to warming over a distance Think in terms of Rack level power and cooling [ Your primary building block ] Zones that are logical groupings of racks / equipment Need to maximize the cooling where it is needed, not overall Need to formally define standards for each zone Implement solutions Collect data Define events / alerts Review reports Take action!
Water and Liquids Back after a brief hiatus More efficient than air Can literally be 3,500 times more efficient Uses one or more chillers Pumps move liquid into data center Direct to devices (cooling in the chassis) To Computer Room Air Conditioners (CRACs) On or above racks Localized in zones
Cooling – Hot and Cold Aisles Don’t want exhaust from one rack going into the input of another Arrange racks so heat dumps into a hot aisle and cold air comes in from cold aisles Position CRACs close to the demand Picture could be one zone Raised floors – IBM recommends 24 inches Clean out under the raised floor Abandoned cables Dust and debris Use structured cabling • Need cooling / perforated tiles in the right places • Seal open rack slots, cable ways, etc. to protect air flow • Keep hot and cold air from mixing with partitions
Cooling – Additional Thoughts (1) Use partitions or otherwise segment zones Prevent coolers from fighting one another Be aware of where hot air is dumped (not out of one cooler and into another's cold air intake) Leverage economizers Groups have them but aren’t using them Batelle study showed 13% lower costs Air side economizers - leverage outside air based on environmental factors including temperature and humidity PG&E reports 60% when airside economizer and air management are combined Fluid side economizers – use a second coolant loop that can be activated to use outside temperatures to augment/replace the primary chiller. Can avoid dust, humidity, etc.
Cooling – Additional Thoughts (2) Underutilization (< 75%) negatively impacts efficiency Make duct runs as short as possible Means locating the air conditioning close to the equipment needing cooling Continuously Monitor and Re-evaluate Cooling Demand side Supply Side New chillers can reduce energy consumption by 50%
Inside the IT Equipment (1) Lower voltage processors Only 30% of power consumed is the processor Fewer voltages in the cabinet Why 5, 3.3 (new) and 12 volt? Every conversion represents a loss Google spec’d out boards that just used 12 volt More efficient power supplies Inefficient power supplies can waste half their power (which also means they are creating more heat) New power supplies are 80% efficient or higher Cost more to purchase but lower operating costs http://www.80plus.org Efficient Power Supplies For Data Centers and Enterprise Servershttp://www.80plus.org/documents/ServerResearchReportFinal.pdf
Inside the IT Equipment (2) Centralized power supplies vs. per device Use fewer transformers and run the power to the racks and devices vs. having a power supply in each rack or even device Reduces the number of “hair dryers” on the floor Hardware compression to reduce storage demands Hard drives are hot! (So is the demand for storage) Look at using compression to reduce the amount of storage needed
Power Demand Did you know that “off” does not equal zero demand? It pays to understand what modes a device supports and leverage them Dell E772 17” Monitor – Maximum Draw 75 Watts, 70 watts typical Suspend less than 5 watts (93% savings) Switched off less than 1 watt (98.7% savings) Develop power profiles of devices If you are on a budget – buy a Kill-A-Watt unit Do you size to turn everything on at once or phase power-ups to reduce peak demand?
Leverage Power Management Features Demand for the IT service varies, but power demand doesn’t vary the way it should Power management is disabled or wrongly configured EPA estimates savings of $25-75/year on just a personal computer See the Energy Star calculatorhttp://www.energystar.gov/ia/products/power_mgt/LowCarbonITSavingsCalc.xls For servers and other systems Understand impacts of power management Response time Stability (not all systems behave well with power mgt) May be some options can be used but not all Newer systems have more power saving features in the BIOS, etc.
Uninterruptible Power Supplies Newer UPSes are 70% more efficient than older ones Sized based on demand, length of average outage and/or how long it will take the generator(s) to stabilize Types: Standby – relay trips over to the battery Line interactive – inverter is always connected providing filtering Double conversion – power is always supplied by the UPS that is simultaneously charging its batteries as well Problems Can generate massive heat Batteries need to be replaced (introducing lead and acid into the environment) Flywheels can replace / augment UPSes Need to still supply power while generators stabilize Could be UPS + flywheel just in case Flywheel’s Power: http://broadcastengineering.com/RF/broadcasting_flywheels_power/Pentadyne’s FAQ’s, Technology, etc. on Flywheels: http://www.pentadyne.com/site/our-products/technology.html
Power Co-Generation (1) Generate power locally / on-site Cover variations in supply Augment supply during peak demand periods Potential to sell power back to the utility Diesel Generators The old standby Getting expensive to run Solar Efficiency is improving Needs direct light, not so great in winter climates Battery bank? See what AISO is doing http://www.aiso.net/solar-powered-network.asp
Power Co-Generation (2) Wind Efficiency is improving Subject to the whims of nature Battery bank See plans by Green House Data http://www.datacenterknowledge.com/archives/2007/Nov/29/wind-powered_data_center_in_wyoming.html Geothermal Great if you have access to geothermal areas Chena hot springs is a great example of possibilities running at only a “warm” temperature http://www.yourownpower.com/
Consolidation and Virtualization #1 - Remove abandoned servers! Server utilization ranges from 6-30% depending on study Look for complementary loads and consolidate Reports range from 3-20 originals integrated into one Assess virtualization to consolidate Servers Assess ability to power-up or down on-demand Desktops even – go to thin client Fault tolerance Re-assess needs for hot N+1 The spare is consuming power and generating heat May not be cost justifiable 100% of the time
Lighting 1% of energy, but very visible – sends a message Plus, 1% of a multimillion dollar energy budget isn’t trivial Why light the data center 24x7? Motion sensor Timers Zones – some lit 24x7 and some not Use high efficiency lighting
Monitoring How many of you know exactly how much power your data center is using? How many can trend it over time? Many environmental systems aren’t on the network and hinder data collection and reporting Many existing data centers do not have granular power tracking and reporting The problem with average cost per port is that it is an average! Odds are that 20% of the systems will consume 80% of the power (or some other ration in line with Pareto’s Law of Inequality)
Formalize and Communicate Standards Develop a team to review and set standards Work with management to formalize the team Engage with facilities to involve them as well on decisions about power and cooling Work with vendors – trust but verify “Greenwashing” Work with management to set the proper “tone” about going green and what it means Communicate wins to the organization
Next Steps Understand power and cooling today Develop a plan of where you want to go Improve cooling efficiency where possible – insulate, close up racks, put perforated floor or ceiling tiles in the right place, control access to the data center, put up partitions, coordinate where hot and cold air are going, etc. Decommission abandoned equipment Stop buying over capacity without understanding operating costs Implement and standardize power management applications/configuration Identify hardware where replacement would generate a true accounting ROI Once configured the right way, use Change Management Assign a team the responsibility to develop standards
Continuous Improvement The first step is only the beginning of a journey Needs will change as technologies and the world changes Leverage metrics where possible to track status Conduct quarterly reviews of progress Formally schedule reviews to assess the current state and look for new opportunities Always look for new opportunities and threats
Thank you for the privilege of facilitating this webcast George Spafford George.Spafford@Pepperweed.com http://www.pepperweed.com The News - Archive, RSS and Email Subscription Instructions http://www.spaffordconsulting.com/dailynews.html (Covers IT management, business, energy, security and a host of other topics)
Resources (1) Mike Ebbers, Alvin Galea, Marc Tu Duy Khiem, and Michael Schaefer. “The Green Data Center – Steps for the Journey” RedPaper Draft (June 2, 2008 Draft)http://www.redbooks.ibm.com/abstracts/redp4413.html[Excellent!] US Department of Energy – Energy Efficiency and Renewable Energyhttp://www1.eere.energy.gov/industry/saveenergynow/partnering_data_centers.html DOE – Creating Energy Efficient Data Centershttp://www1.eere.energy.gov/industry/saveenergynow/pdfs/doe_data_centers_presentation.pdf American Society of Heating, Refrigeration and Air-Conditioning Engineers – Technical Committee 9.9http://tc99.ashraetcs.org/ Creating the Green Data Center http://www.adc.com The Data Center Journalhttp://datacenterjournal.com/ The Green Gridhttp://www.thegreengrid.org
Resources (2) Simon Mingay. “10 Key Elements of a ‘Green IT’ Strategy”. Gartner. December 2007. Energy Information Administration. Electric Power Monthlyhttp://www.eia.doe.gov/cneaf/electricity/epm/epm_sum.html National Data Center Energy Efficiency Information Programhttp://www1.eere.energy.gov/industry/saveenergynow/pdfs/national_data_center_fact_sheet.pdf Lawrence Berkeley National Labs – Data Center Best Practiceshttp://hightech.lbl.gov/datacenters.html Kenneth G Brill. “Data Center Energy Efficiency and Productivity”. The Uptime Institute. 2007.http://www.cio.co.uk/whitepapers/index.cfm?whitepaperid=4241 Cogeneration & On-site Power Productionhttp://www.cospp.com US Department of Energy – Distributed Energy Programhttp://www.eere.energy.gov/de/ Chena Hot Springs Geothermal Projecthttp://www.yourownpower.com/ State of California – Distributed Energy Resource Guidehttp://www.energy.ca.gov/distgen/index.html
Resources (3) Cisco Energy Efficient Data Center Solutions and Best Practiceshttp://www.cisco.com/en/US/solutions/ns708/networking_solutions_products_genericcontent0900aecd806fd32e.pdf High Performance Data Centers: A Design Guidelines Source Bookhttp://hightech.lbl.gov/documents/DATA_CENTERS/06_DataCenters-PGE.pdf[Excellent! Well researched and includes references. ] Energy Fit @ Los Alamos National Labshttp://www.lanl.gov/orgs/tt/pdf/techs/energyfit_tech.pdf Giving Data Center Cooling Systems a Boosthttp://www.weigelmep.com/White%20Paper%20-%20Giving%20Data%20Center%20Cooling%20Systems%20a%20Boost.pdf Thinking inside the box: Boosting the effectiveness of air coolinghttp://www.mil-embedded.com/articles/id/?3281 Uptime Institutehttp://www.uptimeinstitute.org/
Thank you for attending If you have any further questions, e-mail webcasts@jupitermedia.com For future internet.com Webcasts, visit www.internet.com/webcasts