Download
1 / 27
270 likes | 378 Views
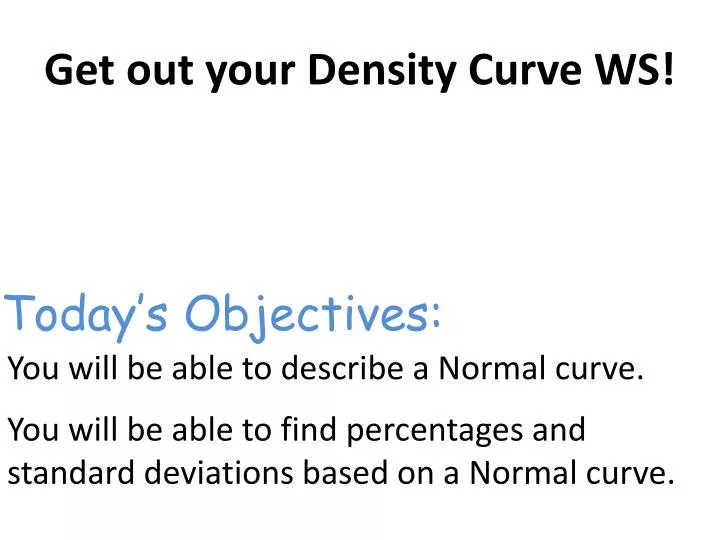
Today’s Objectives:. Get out your Density Curve WS! You will be able to describe a Normal curve. You will be able to find percentages and standard deviations based on a Normal curve. Normal Curves. The Normal curves are one of the most common types of density curve.

E N D
Today’s Objectives: Get out your Density Curve WS! You will be able to describe a Normal curve. You will be able to find percentages and standard deviations based on a Normal curve.
Normal Curves The Normal curves are one of the most common types of density curve. All Normal curves are... Symmetric Single-peaked Bell-shaped
Normal Curves Normal curves describe Normal distributions. Normal distributions are anything but “normal.” They play a huge role in statistics. Capitalize the “n” in normal when referring to a Normal distribution or curve.
Why Important? Normal distributions are important in statistics because… Normal distributions are good descriptions for some distributions of real data. Ex. Scores on tests, repeated careful measures of the same quantity, characteristics of biological populations…
Why Important? Normal distributions are important in statistics because… Normal distributions are good approximations to the results of many kinds of chance outcomes. Ex. tossing a coin many times, rolling a die…
Why Important? Normal distributions are important in statistics because… Most importantly, Normal distributions are the basis for many statistical inference procedures. Inference—the process of arriving at some conclusion that possesses some degree of probability relative to the premises
Normal Curves Symmetric, single-peaked, and bell-shaped. Tails fall off quickly, so do not expect outliers. Mean, Median, and Mode are all located at the peak in the center of the curve. Mean Median Mode
Normal Curves The mean fixes the center of the curve and the standard deviation determines its shape. The standard deviation fixes the spread of a Normal curve. Remember, spread tells us how much a data sample is spread out or scattered.
Normal Curves The mean and the standard deviation completely specifies the curve. Changing the mean changes its location on the axis. Changing the standard deviation changes the shape of a Normal curve.
The Empirical Rule Also known as the 68—95—99.7 Rule because these values describe the distribution. The empirical rule applies only to NORMAL DISTRIBUTIONS!!!!!
The Empirical Rule The Empirical Rule states that Approximately 68% of the data values fall within one standard deviation of the mean Approximately 95% of the data values fall within 2 standard deviations of the mean Approximately 99.8% of the data values fall within 3 standard deviations of the mean
The Empirical Rule of the observations fall within standard deviation around the mean. 68% of data
The Empirical Rule of the observations fall within standard deviation around the mean. 95% of data
The Empirical Rule of the observations fall within standard deviation around the mean. 99.8% of data
The Empirical Rule 99.8% of data 95% of data 68% of data
Examples Assume you have a normal distribution of test scores with a mean of 82 and a standard deviation of 6. 34% 13.5% 34% 13.5% .1% 2.4% 2.4% .1%
Examples What percent of the data scores were above a 76? 34% 13.5% 34% 13.5% .1% 2.4% 2.4% .1% 64 70 76 82 88 94 100
Examples 68% of the data fall between what two scores? 34% 13.5% 34% 13.5% .1% 2.4% 2.4% .1% 64 70 76 82 88 94 100
Examples 3. What percent of the data scores fall between 70 and 100? 34% 13.5% 34% 13.5% .1% 2.4% 2.4% .1% 64 70 76 82 88 94 100
Examples 4. How many standard deviations away from the mean is 88, and in which direction? 34% 13.5% 34% 13.5% .1% 2.4% 2.4% .1% 64 70 76 82 88 94 100
Examples 5. How many standard deviations away from the mean is 64, and in which direction? 34% 13.5% 34% 13.5% .1% 2.4% 2.4% .1% 64 70 76 82 88 94 100
Examples A charity puts on a relay race to raise money. The times of the finishes are normally distributed with a mean of 53 minutes and a standard deviation of 9.5 minutes. 34% 13.5% 34% 13.5% .1% 2.4% 2.4% .1%
Examples What percent of the data times were between 34 and 81.5 minutes? 34% 13.5% 34% 13.5% .1% 2.4% 2.4% .1% 24.5 34 43.5 53 62.5 72 81.5
Examples 95% of the data fall between what two times? 34% 13.5% 34% 13.5% .1% 2.4% 2.4% .1% 24.5 34 43.5 53 62.5 72 81.5
Examples What percent of the data times were below 72 minutes? 34% 13.5% 34% 13.5% .1% 2.4% 2.4% .1% 24.5 34 43.5 53 62.5 72 81.5
Examples 4. How many standard deviations away from the mean is 34 and in which direction? 34% 13.5% 34% 13.5% .1% 2.4% 2.4% .1% 24.5 34 43.5 53 62.5 72 81.5
Homework Normal Curve Worksheet Due Monday