Download
1 / 2
150 likes | 834 Views
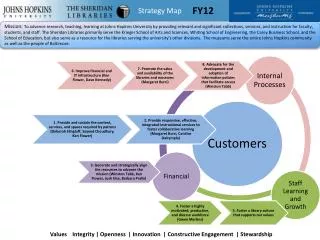
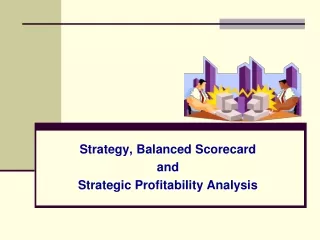
A Good Balanced Scorecard Strategy Map Tells the Story of Your Strategy. The Revenue Growth Strategy. The Productivity Strategy. “Improve stability by broadening the sources of revenue from current customers”.

E N D
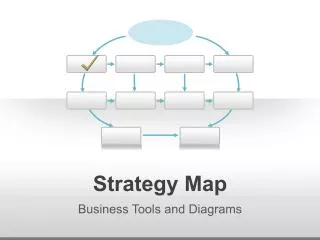
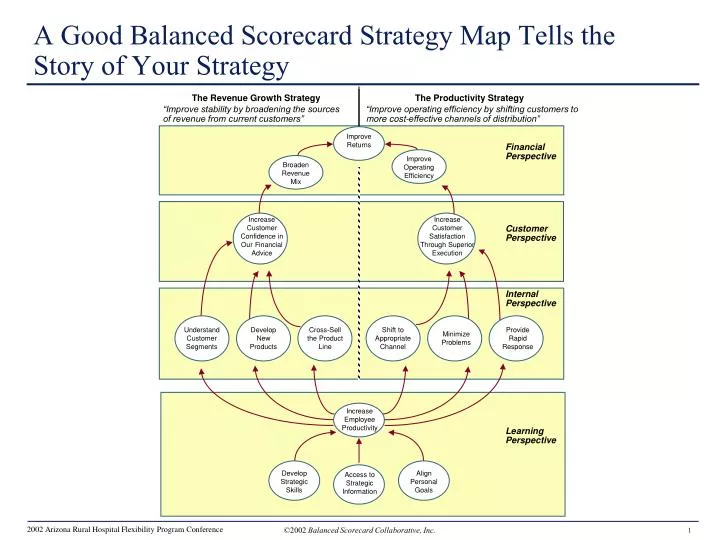
A Good Balanced Scorecard Strategy Map Tells the Story of Your Strategy The Revenue Growth Strategy The Productivity Strategy “Improve stability by broadening the sources of revenue from current customers” “Improve operating efficiency by shifting customers to more cost-effective channels of distribution” Improve Returns Financial Perspective Improve Operating Efficiency Broaden Revenue Mix Increase Customer Confidence in Our Financial Advice Increase Customer Satisfaction Through Superior Execution Customer Perspective Internal Perspective Understand Customer Segments Develop New Products Cross-Sell the Product Line Shift to Appropriate Channel Provide Rapid Response Minimize Problems Increase Employee Productivity Learning Perspective Develop Strategic Skills Align Personal Goals Access to Strategic Information
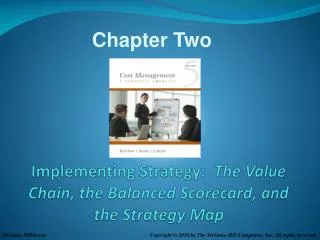
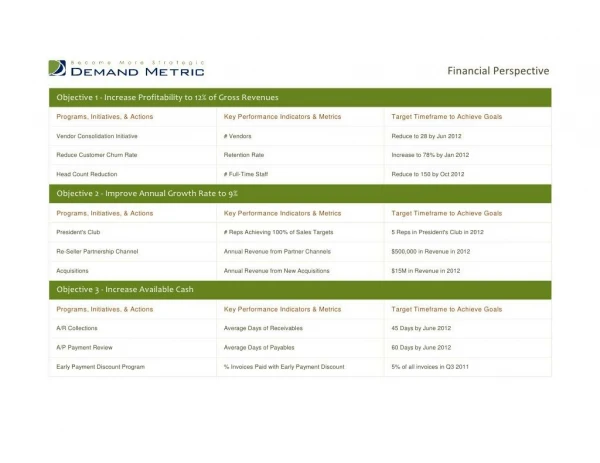
A Good Balanced Scorecard Tells the Story of Your Strategy Through A Set of Linked Cause and Effect Hypotheses Strategic Measurements StrategicObjectives (Lag Indicators) (Lead Indicators) • Return on Investment • Revenue Growth • Deposit Service Cost Change • Revenue Mix F1 - Improve Returns F2 - Broaden Revenue Mix F3 - Reduce Cost Structure Financial C1 - Increase Customer Satisfaction With Our Products & People C2 - Increase Satisfaction “After the Sale” • Share of Segment • Customer Retention • Depth of Relation • Satisfaction Survey Customer I1 - Understand Our Customers I2 - Create Innovative Products I3 - Cross-Sell Products I4 - Shift Customers to Cost-Effective Channels I5 - Minimize Operational Problems I6 - Responsive Service • New Product Revenue • Cross-Sell Ratio • Channel Mix Change • Service Error Rate • Request Fulfillment Time • Product Development Cycle • Hours with Customers Internal • Strategic Job Coverage Ratio • Strategic Info Availability Ratio • Personal Goals Alignment (%) L1 - Develop Strategic Skills L2 - Provide Strategic Info L3 - Align Personal Goals • Employee Satisfaction • Revenue per Employee Learning