Download
1 / 22

E N D
As the database of animal tracks began to grow, scientists started noticing exciting patterns in how marine animals use the ocean environment. There seem to be particular areas of the ocean that are heavily used marine animals. These areas of the ocean are called “biological hotspots”. Where are the biological hotspots in the Pacific Ocean and what species use them? In this module, you’re going to inspect the Ocean Tracks data to answer those questions. Then, you’re going to identify pieces of data that give you some clues about why these hotspots exist.
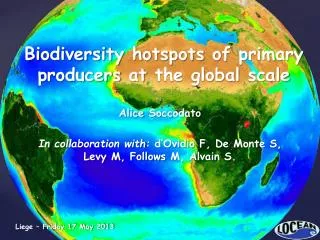
Research Use the Ocean Tracks library and the internet to research the concept of biological hotspots. Through your research, try to answer the following questions: • What is biodiversity and why is it important? • Why is identifying the locations of biodiversity hotspots important? • Where are some of the world’s biodiversity hotspots? • Generate a research question of your own for you to answer. Record your notes on additional slides
Research Next, use the Ocean Tracks library to learn about the hotspot tool. Keep in mind that in Ocean Tracks, we’re going to focus on two types of hotspots: Diversity hotspots are areas that are used by many different species Species hotspots are areas that are used by many individuals of the same species Diversity hotspots may be located in the same or different areas than species hotspots. Track points are more dense Track points are less dense No track points Hotspot tool: How does it work? The hotspot tool assigns a color according to how dense the track points are on the map. The more points there are in an area, the brighter red the color is. Green colors indicate areas where track points are less dense. Areas of the map without track points are not given a color.
Use the hotspot tool to generate hotspot maps using different numbers of tracks from different species to answer the following questions: • How does the hotspot map change as you add tracks? Do certain patterns become more clear? • Do different species seem to have different hotspots? Record your notes and thoughts on additional slides
Data Collection Plan Describe the methods you will use to identify the location of your hotspot. Also take some measurements that help you determine what the animals are doing in your hotspot. Here are some prompts that can help you with your planning: • How will you go about trying to find the diversity hotspot? What information do you need? What data do you need to collect? • Which tracks will you look at? Which species will you use? • How many tracks will it be necessary to study? • What observations will you record? • What measurements will you make? • How will you record your observations and measurements? • What additional questions do you have and how will you answer those questions? Record this information on additional slides STOP Discuss your data collection plan with your teacher before moving on
Data Collection Create new slides to include your observations and measurements. Be sure to include your own comments on what you observe, your measurements of the data you collect (organized into tables and/or graphs), screen shots, and additional questions you may have.
State a Claim Where is your diversity hotspot in the Pacific Ocean? What are the animals doing in this hotspot?
State a Claim Copy a visualization here that shows the location of your hotspot.
Provide Evidence Which tracks, observations, and measurements helped you determine the location of your hotspot and what the animals are doing there?
Explain Your Reasoning How do the tracks, observations, and measurements you chose support your claim?
Share Your Findings As a class, compare the locations of the diversity hotspots that each group identified. Each group will justify why they chose that hotspot. Are there similarities in the locations of these hotspots? Are there differences? If so, why does this variation exist?
Share Your Findings Which hotspot has the most evidence to support it? As a class, agree on a final diversity hotspot.
Research Use the Ocean Tracks library and the internet to research the map overlays on the Ocean Tracks interface (SST, chlorophyll concentration, currents, and bathymetry). Through your research try to answer the following question: • How might oceanographic factors create conditions in the ocean that attract many species? Record the results of your research on additional slides
Data Collection Plan Develop a research/data collection plan that will help you answer the following questions: • Why does this diversity hotspot attract so many animals? • What are the oceanographic conditions in this area? Here are some prompts that can help you with your planning: • What information do you need to answer the above questions? • What data do you need to collect? How will you access this data? • What observations will you record? • What measurements will you make? • How will you record your observations and measurements? • What additional questions do you have and how will you answer those questions? Create an additional slide and outline the methods you will use to conduct your data collection Discuss your data collection plan with your teacher before moving on STOP
Data Collection Use the next series of slides to include your observations and measurements. Be sure to include your own comments on what you observe, your measurements of the data you collect (organized into tables and/or graphs), screen shots, and additional questions you may have.
State a Claim State why this diversity hotspot attracts so many animals.
Provide Evidence List the pieces of evidence (your observations, measurements, research) that helped you determine why this area is a diversity hotspot.
Explain Your Reasoning Describe how the evidence you generated explains why this area is a hotspot. In your answer you should include connections to relevant scientific concepts like primary production, upwelling, food web, etc.
Share Your Findings As a group, share your reasoning for why this hotspot exists.