Download
1 / 34
340 likes | 554 Views
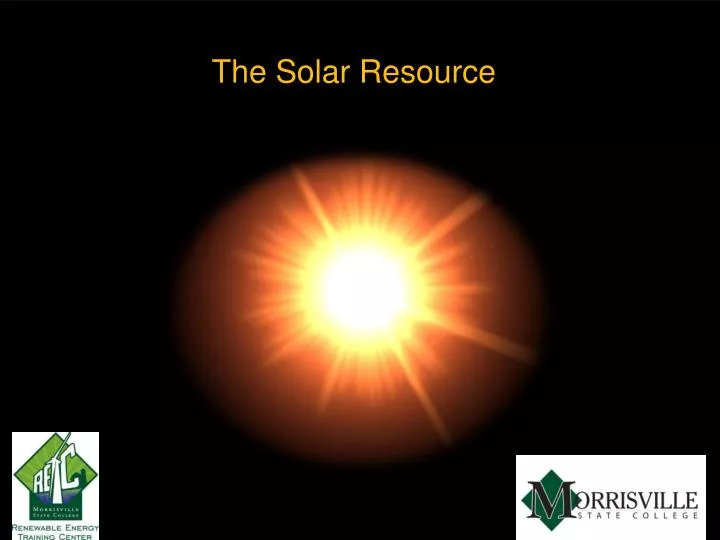
The Solar Resource. Overview. Overview of the solar resource in the U.S. Features impacting solar irradiance Latitude, cloud cover, seasonality Converting power to energy Tools to measure solar energy and shading An overview of solar energy systems. Solar PV. Solarbuzz LLC. .

E N D
Overview • Overview of the solar resource in the U.S. • Features impacting solar irradiance • Latitude, cloud cover, seasonality • Converting power to energy • Tools to measure solar energy and shading • An overview of solar energy systems http://retc.morrisville.edu
Solar PV Solarbuzz LLC. http://retc.morrisville.edu
So Germany must be sunny, right? http://retc.morrisville.edu
Measuring the solar resource • Magnetic declination • Solar pathways • Solar math (power to energy) • Latitude and curvature • Air currents http://retc.morrisville.edu
What impacts solar gain each day? Latitude (winter solstice) http://retc.morrisville.edu http://dcweather.blogspot.com/2005/12/winter-time-in-washington_21.html
Sun Path – New York Summer Solstice Equinox Winter Solstice E N S W This angle should be equal to your latitude http://retc.morrisville.edu
Magnetic Declination http://sos.noaa.gov/images/Land/magnetic_declination.jpg http://retc.morrisville.edu
True south and declination http://www.ngdc.noaa.gov/geomag/icons/us_d_contour.jpg http://retc.morrisville.edu
Declination corrections True North Magnetic North 12°48’ W http://www.ngdc.noaa.gov/geomagmodels/Declination.jsp True South http://retc.morrisville.edu
Solar Angles by month in Morrisville http://retc.morrisville.edu
What impacts solar gain each day? • Latitude http://www.hort.purdue.edu/newcrop/tropical/lecture_02/04m.jpg http://retc.morrisville.edu
Morrisville’s Solar Resource http://retc.morrisville.edu
Morrisville’s Solar Resource kWh/m2/day = http://retc.morrisville.edu
Morrisville’s Solar Resource kWh/m2/day = • Yearly mean power? • 144.1 W/m2/day • Yearly mean energy? • 3.5 kWh/m2/day http://retc.morrisville.edu
Solar energy throughout the year MSC weather station data http://retc.morrisville.edu
How does central NY compare? • Average of solar energy throughout the year is 3.5 kWh/m2/day. • This is 1277.5 kWh/m2/year (365 days * 3.5 per day) • Albany has a daily average of 4.3 kWh/m2/day (1569.5 kWh/m2/year) • San Diego has 7.3 kWh/m2/day (2664.5 kWh/m2/year) http://retc.morrisville.edu
Solar energy http://retc.morrisville.edu
Cloud cover http://retc.morrisville.edu http://www.colorado.edu/geography/class_homepages/geog_3251_sum08/07_rainshadow.jpg
Air Cells Low pressure http://www.earlham.edu/~biol/desert/hadley.JPG Rain Forests (cloudy) Deserts (sunny) High pressure http://retc.morrisville.edu
Global Solar Energy http://earth-www.larc.nasa.gov http://retc.morrisville.edu
Solar energy systems • If you assume that systems costs are comparable in NY and southern California, which location has more expensive solar energy? http://retc.morrisville.edu
Estimating the Solar Resource http://retc.morrisville.edu
Estimating the Solar Resource http://retc.morrisville.edu
Estimating the Solar Resource S W E http://retc.morrisville.edu
Estimating the Solar Resource June (lowest line): 1+1+2+2+3 = 9% July (next up): 1+1+2+3+3 = 10% May: 1+1+2+3+3 = 10% August: 1+1+2+2+3 = 9% April: 1+2+2+3 = 8% September: 1+2+2 = 5% October: 1% http://retc.morrisville.edu
Estimating the Solar Resource http://retc.morrisville.edu
Solar energy systems http://retc.morrisville.edu
Photovoltaics http://retc.morrisville.edu
Solar Thermal Electricity Parabolic mirrors http://retc.morrisville.edu
Solar Hot Water Images courtesy of John Siegenthaler • Domestic solar hot water system • Flat plate collector (low temp) • Evacuated tubes (higher temp) • Solar hot water tank with heat exchanger http://retc.morrisville.edu
Passive Solar Heating Thermal mass Conifers to the north Large windows facing south Small windows to north http://retc.morrisville.edu
Summary • New York has an adequate solar resource for solar PV, solar hot water, and passive solar homes • Solar power can be easily converted to solar energy (and we can account for shading) • Incoming solar energy is affected by many factors such as latitude, cloud cover, and time of year • Many systems can take advantage of solar energy http://retc.morrisville.edu
Contact Information Phil Hofmeyer, Ph.D.Assistant ProfessorPh: 315-684-6515 Email: hofmeypv@morrisville.edu Web: http://people.morrisville.edu/~hofmeypv/ Ben Ballard, Ph.D.Director, RETC Assistant ProfessorPh: 315-684-6780 Email: ballarbd@morrisville.edu Web: http://people.morrisville.edu/~ballarbd/ http://retc.morrisville.edu