Download
1 / 8
100 likes | 261 Views
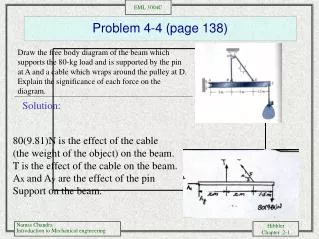
Problem 4 - 20. Development of three regression models to predict the selling price of a home based upon square footage, age, and number of bedrooms. Scatter Diagram . Scatter Diagram. Scatter Diagram. Which model is best?.

E N D
Problem 4 - 20 Development of three regression models to predict the selling price of a home based upon square footage, age, and number of bedrooms Jan White
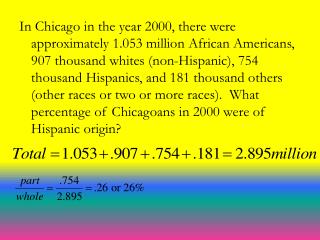
Scatter Diagram Jan White
Scatter Diagram Jan White
Scatter Diagram Jan White
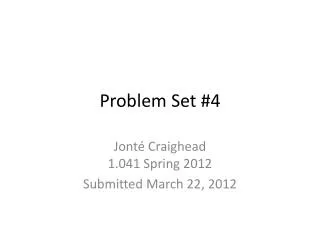
Which model is best? Based on the output values shown for each model, the best model is correlation between Selling Price/Age, followed closely by Selling Price/Square Footage. Both of the above models have a high r2 value (over 0.5). Both of the above models have a low F-test value (under 0.5) Jan White