Download
1 / 58
610 likes | 832 Views
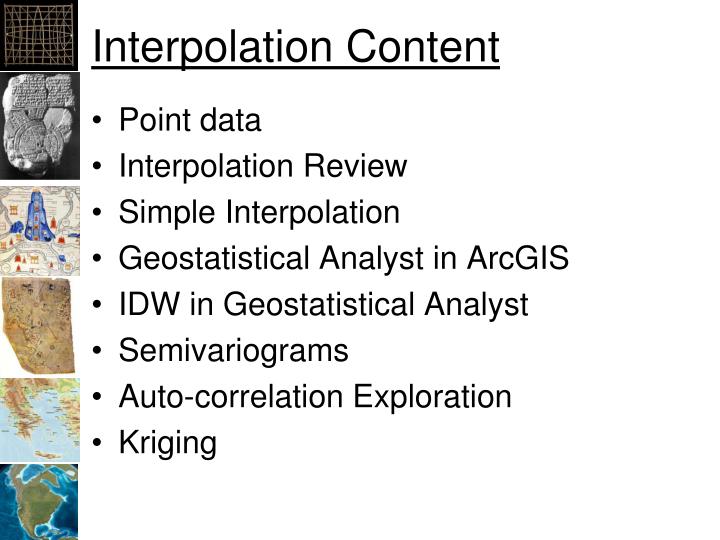
Interpolation Content. Point data Interpolation Review Simple Interpolation Geostatistical Analyst in ArcGIS IDW in Geostatistical Analyst Semivariograms Auto-correlation Exploration Kriging. US Temperature Range. US Weather Stations. ~450 km. http://www.raws.dri.edu/. Interpolation.

E N D
Interpolation Content • Point data • Interpolation Review • Simple Interpolation • Geostatistical Analyst in ArcGIS • IDW in Geostatistical Analyst • Semivariograms • Auto-correlation Exploration • Kriging
US Weather Stations ~450 km http://www.raws.dri.edu/
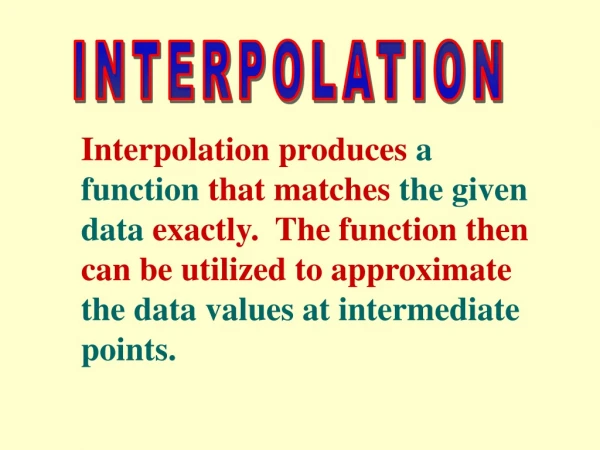
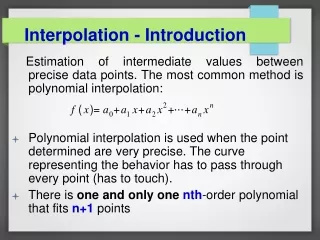
Interpolation • Interpolation is a method of constructing new data points within the range of a discrete set of known data points.
John Snow Soho, England, 1854 Cholera via polluted water
Simple Interpolation 50 40 35 Measured Values 20 Spatial Cross-section
Linear Interpolation 50 40 35 Measured Values 20 Spatial Cross-section
Linear Interpolation • Trend surface with order of 1 50 40 35 Measured Values 20 55 47 42 36 36 37 38 40 34 28 21 Spatial Cross-section
Process • Obtain points with measurements • Evaluate data (autocorrelation) • Interpolate between the points using: • Nearest (Natural) Neighbor • Trend (fitted polynomial) • Inverse Distance Weighting • Kriging • Splines • Density • Convert the raster to vector using contours
Inverse Distance Weighting • Points closer to the pixel have more “weight” ArcGIS Help
Inverse Distance Weighting • Fk=new value • wi=weight • fi=data value • Square root of distance to point over sum of square root of all distances • General case • “Shepard's Method” More information: http://en.wikipedia.org/wiki/Inverse_distance_weighting
Inverse Distance Weighting • No value is outside the available range of values • Assumes 0 uncertainty in the data • Smooth's the data
Kriging • Semivariograms • Analysis of the nature of autocorrelation • Determine the parameters for Kriging • Kriging • Interpolation to raster • Assumes stochastic data • Can provide error surface • Does not include field data error (spatial or measured)
Semivariance • Variance = (zi - zj)2 • Semivariance = Variance / 2 zj zi - zj zi Distance Point i Point j
Semivariance • For 2 points separated by 10 units with values of 0 and 2: 2 Semivariance ( 0 – 2 )2/2 = 2 Distance Between Points 10
Variogram - Formal Definition • For each pair of points separated by distance h: • Take the different between the attribute values • Square it • Add to sum • Divide the result by the number of pairs
Range, Sill, Nugget www.unc.edu
Semivariogram Andraski, B. J. Plant-Based Plume-Scale Mapping of Tritium Contamination in Desert Soils, vadzone, 2005 4: 819–827
Synthetic Data Exploration • To evaluate a new tool: • Create simple datasets in Excel or with a Python • Ask your self: • How does the tool work? • What are it’s capabilities? • What are it’s limitations?