Download
1 / 41
410 likes | 565 Views
Intro to Restoration Ecology. ENSC 201 – Spring 2008. Why do we need restoration?. 53 % of wetlands lost nationwide > 35 % of wetlands lost in Vermont 50-70% loss of brackish intertidal mudflats, shores, and coastal plains 90 % loss of aquatic vegetation in the Chesapeake Bay

E N D
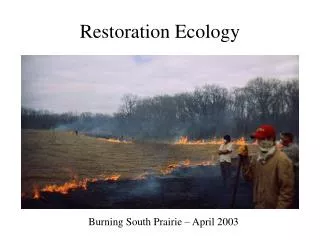
Intro to Restoration Ecology ENSC 201 – Spring 2008
Why do we need restoration? • 53 % of wetlands lost nationwide • > 35 % of wetlands lost in Vermont • 50-70% loss of brackish intertidal mudflats, shores, and coastal plains • 90 % loss of aquatic vegetation in the Chesapeake Bay • 70 % loss of riparian forests nationwide • 90 % loss of old-growth forests nationwide • 99.5 % loss of old-growth forests in the eastern U.S. • 97 % loss of pine-oak-heathland in the Lake Champlain Basin • 90 % loss of short and tall-grass prairie ecosystems nationwide • 90 % of shrub-steppe ecosystems degraded by livestock grazing nationwide Source: Noss et al (1995)
How do we prioritize areas for restoration? • Need • Ecological value • What is the relative importance of different sites for ecosystem functioning? • Examples: • Riparian areas • Headwaters • Estuaries • Unstable uplands • Wetland complexes • Rare communities • Critical habitats for particular species • Degree of degradation? • Degree of threat more applicable for identifying areas in need of protection or conservation • Opportunity
How does restoration fit into an overall conservation or sustainability strategy? The Functional Landscape Approach
But what about entire ecosystems that have been severely degrade? Answer: We need an ecosystem-level restoration approach
Restoration as The Acid Test of Ecology: Do we understand how ecosystems work well enough to reconstruct them?
Ecosystem-Level Restoration • Focus on ecological processes • Examples: • Soil productivity • Natural disturbance dynamics • Hydrology • Ecological succession!
Tiered Restoration Ecosystem restoration: “Bringing back an entire system or the dynamics of that system” Large-scale Coordinated restoration of critical areas as per an overall ecosystem management plan Site-specific restoration, remediation, mitigation, etc. Small-scale
Atlantic Rainforest Restoration • The Atlantic rainforest once covered 400,000 square miles • Only 7% remains • 450 tree species per hectare • 2.7% of world’s plant species just in what is left • Testing innovative funding mechanisms U.S. companies paying for carbon sequestration • How do we restore it?
Carbon Revenue • Estimates of potential carbon credit values range from $4 to $60 (or even $110) per ton of C. • European market currently trading for $8 to $20 per metric ton. • Future value could increase substantially as international carbon markets develop.
Chicago Climate Exchange • “Voluntary ‘Cap and Trade’ greenhouse gas emission reduction and trading system.” • One Mg Carbon trading for about $5 • Membership from the forest products industry includes: • Abitibi-Consolidated • Aracruz Celulose S.A. • Cenibra Nipo Brasiliera S.A. • International Paper • Klabin S.A. • MeadWestvaco Corp. • Stora Enso North America • Suzano Papel E Celulose SA • Temple-Inland Inc
Forest Cover Trends in New England Since European Settlement
Differences Between Pre-Settlement and Current Forests in VT and NH Forest Composition Species:Abundance: Chestnut Elm Beech Sugar Maple Hemlock White Pine Red Spruce White Birch Cottonwood Pin Cherry Red Maple Communities:Abundance: Old-Growth Forest of All Types Floodplain Silver Maple and Sugar Maple Rich Lowland Oak/Basswood/Ash Forested Wetlands Native Grasslands and Shrublands Functionally Extirpated Sources: Cogbill (2000); McLachlan et al. (2000); Fuller et al. 1998;Foster 1992; Siccama (1971)
Restoration as Experimentation What are the elements of experimental design?