Download
1 / 16
160 likes | 273 Views
REX: NYSE www.rexamerican.com. One Earth Energy, LLC Gibson City, IL. Stuart Rose, Chairman & CEO Doug Bruggeman, CFO March 2012.

E N D
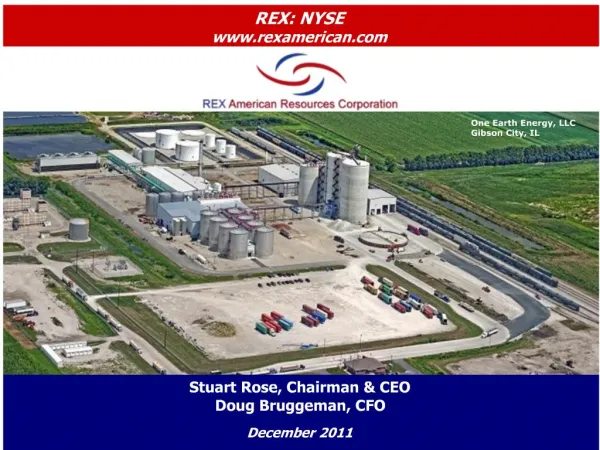
REX: NYSE www.rexamerican.com One Earth Energy, LLCGibson City, IL Stuart Rose, Chairman & CEO Doug Bruggeman, CFO March 2012
This presentation contains forward-looking statements within the meaning of Section 27A of the Securities Act of 1933 and Section 21E of the Securities Exchange Act of 1934. Such statements can be identified by use of forward-looking terminology such as “project,”“may,”“expect,”“estimate,”“anticipate” or “continue” or the negative thereof or other variations thereon or comparable terminology. You are cautioned that there are certain risks and uncertainties that could cause actual events or results to differ materially from those referred to in such forward-looking statements. These risks and uncertainties are described in our filings with the Securities and Exchange Commission. Safe Harbor
REX Overview • Successful alternative energy investor since 1998 • Synfuel investments of $6M yielded ~$178M return over 10 years • Discontinued legacy retail operations in FY ’09 to focus on alternative energy • Ethanol investments initiated in 2006 • $24M profit in FY’ 07 on $14M early ethanol investment • Alternative energy represented 99.7% of revenue and 83.8% of assets (1/31/12) • Ownership in seven operating ethanol production facilities representing • In aggregate, 668.8 million gallons of TTM annual gallons sold by seven plants • REX effective ownership interest of TTM gallons sold = 248.2 million gallons • Revenues from ethanol, distillers grain & corn oil • Strong, liquid balance sheet (as of 1/31/12)(based on 8.4M diluted shares) • Unrestricted cash of $46.1M ~ $ 5.49/share • Net book value of retail real estate $17.5M ~ $ 2.08/share • Carrying value of ownership in seven plants $197.8M ~ $23.50/share • REX shareholders’ book value $252.5M~$30.06/share • ROE-focused asset allocation discipline • 11.2% average ROE since 1993 (despite low returns on high cash balances) • Share repurchase program • Insider ownership approximately 33%
Alternative Energy Investments • Entered alternative energy sector FY ‘98 investing in two synthetic fuel LP’s • Earned federal income tax credits based on the tonnage and content of solid synthetic fuel produced and sold to unrelated parties • Sold interests in both partnerships and received quarterly income subject to production levels and phase-outs through calendar 2007 • Purchased 3rd synthetic fuel facility in FY ‘02; was sold in FY ’04 • Synfuel partnership performance - FY ’98 - FY ’11 • Total investment income ~$130M from sale of partnership interests • Allocated income tax credits of ~$48M • Plus $2.9M in income received in Q2 ‘11 from plant sold in 2006 • Entered ethanol sector FY ’06 and REX currently has: • Investments in seven operating ethanol production facilities • Effective ownership of ~248 million annual gallons sold
Ethanol Industry Considerations • Ethanol industry blends approximately 14 billion gallons per year, thereby reducing our reliance on foreign oil • Helps U.S. balance of trade • Helps country move towards energy independence • Approximately 1/3 of corn used in ethanol production is returned to feed market in the form of DDG, corn gluten meal and feed* • National benefits • Farmers require fewer price subsidies • Land being transitioned away from “land bank” • Ethanol generates higher tax revenues • Ethanol production added nearly $54 bn to GDP* • Ethanol production increased household income by $36 bn* • Effective 1/1/12 industry no longer receives tax subsidies (VEETC) • Farm states less impacted by challenged economic environment • Ethanol estimated to have created 400,000 jobs across ancillary industries from agriculture to manufacturing to the service sector* * Source: Renewable Fuels Associations 5
REX Ethanol Portfolio PLANT REX’S CURRENT TTM GALLONS CURRENT EFFECTIVE OWNERSHIP ENTITY/LOCATION SOLD REX OWNERSHIP OF TTM GALLONS SOLD (millions) INTEREST (millions) One Earth Energy, LLC Gibson City, IL104.674% 77.4 NuGen Energy, LLC Marion, SD 114.6 99% 113.5 Patriot Renewable Fuels, LLC Annawan, IL114.826% 29.8 Big River Resources West Burlington, LLC West Burlington, IA (1)105.510% 10.5 Big River Resources Galva, LLC Galva, IL (1) 106.4 10% 10.5 Big River United Energy, LLC Dyersville, IA 118.2 5% 5.9 Big River Resources Boyceville, LLC Boyceville, WI (1) 4.7 10% 0.5 TOTAL (2)668.8 n/a248.2 • REX’scurrent effective annual gallons sold represents one month of ownership of Big River Resources Boyceville, LLC. • Table excludes results related to the LHCE operations which ceased production in January 2011.
Acquisition of Additional NuGen Interest • Effective 11/1 acquired additional 50% equity interest in NuGen Energy ethanol production plant, raising REX’s ownership to 98% • Total cash consideration of $12.7 million for additional equity and REX’s remaining contingent liability and REX made a $7.0 million capital contribution to reduce NuGen long-term debt • Transaction funded with cash on hand • NuGen’s non-recourse bank debt refinanced • $55 million mortgage debt and $10 million revolving credit facility • Increases REX’s ownership of annual gallon production by ~30% • Results are consolidated in REX’s financial statements beginning Q4FY’11 • In 2/12 NuGen repurchased shares which had the effect of raising REX’s equity ownership in the facility to 99% • NuGen operates a nameplate 100 mgy ethanol production facility • Favorable location with excellent infrastructure including railroad, natural gas and local corn supply • Produced 115.7 mgy and 110.3 mgy of denatured ethanol in FYE 7/31/11 and 7/31/10, respectively • Sold 114.6 million gallons in TTM 1/31/12 • Plant built by Fagen, Inc. with ICM, Inc. technology * EBITDA, or earnings before interest, taxes, depreciation and amortization is not a measure of performance or liquidity calculated in accordance with GAAP. EBITDA for NuGen is calculated by adding interest expense, net and depreciation and amortization expense to pre-tax net income. 7
REX Ethanol Strategy • Disciplined investment criteria • Invest only if project meets strategic and financial risk and return criteria • Align with farmers, farm cooperatives and farming communities as co-investors and owners of ethanol production facilities • Facilitates access to grain supply, local community support • Locate plants close to rail access and feedstocks • Utilize state-of-the-art ethanol production technology • Dry mill corn-processing • All plants are highly efficient Fagen, Inc. and/or ICM, Inc. • Fagen is large, respected U.S. green energy design-builder • ICM engineers, builds, and supports renewable fuel bio-refineries • ICM process technology produces ~6.6 billion gallons of ethanol • Seek to match grain prices with ethanol and DDG sales at most plants • Forward grain purchases and ethanol sales contracts generally two month duration • Derivative contracts are generally not employed to hedge commodity price risks • Maximize ethanol plant returns via: • Running plants efficiently, often above nameplate capacity • Sale of dried (and wet) distillers grain (DDG) as animal feed • Adding corn oil production capabilities
Ethanol Federal EPA ethanol purchasing mandates continue to rise, requiring refiners to purchase more ethanol each year: YearTarget 2011 12.6 BGY 2012 13.2 BGY 2013 13.8 BGY 2014 14.4 BGY 2015 & beyond 15.0 BGY $0.45 per gallon VEETC (blender’s credit) expired Dec. 31, 2011 Distillers Grain Rising corn prices have driven DDG pricing increases, helping offset impact on crush spreads Demand/Pricing Drivers
Crush Spread & DDG Pricing • Crush Spread = price of 1 gallon of ethanol - cost of corn to produce it • One bushel of corn makes ~2.8 gallons of ethanol • Crush spread = Ethanol price – (Corn bushel price / 2.8) • Crush spread excludes other production, transportation costs, etc. • Dried distillers grain (DDG) pricing has offset weaker crush spreads in 1H’11 and supplemented improved crush spreads in 2H’11 • REX’s average realized DDG prices per quarter are reflected on green line below. Calculated using CBOT monthly average prices
Operating Results Twelve Months Ended $ in millions, except per share data 1/31/121/31/11 Net sales and revenue: Alternative energy (1)$408.7$300.4 Real estate 1.31.0 Total net sales and revenue $410.0$301.4 Gross profit $33.8$30.6 Segment profit (loss): Alternative energy (1)$48.7 $13.4 Real estate (1.5) (0.8) Corporate expense (2.3) (2.7) Income from synthetic fuel partnership 2.9 -- Interest income, net 0.20.2 Income from continuing operations including non-controlling interests$31.9$7.1 Net income from continuing operations $26.5 $3.4 Net income from continuing operations per share $2.88 $0.34 Net income $28.3 $5.1 Diluted net income per share $3.08 $0.52 Weighted average diluted shares outstanding 9.2 9.8 • Includes results attributable to non-controlling interests of approximately 44% for Levelland Hockley in fiscal year 2010 and 26% for One Earth in fiscal year 2010 and fiscal year 2011. Effective January 31, 2011, REX reduced its equity ownership in Levelland Hockley to 49% from 56%. Beginning November 1, 2011, the non-controlling interests of NuGen, which equal approximately 2.5% are included in the results.
Strong Balance Sheet $ in millions1/31/121/31/11 Cash and Cash Equivalents $ 75.0 $ 91.0 Total Current Assets 127.0 125.8 Property & Equipment, net 240.1 169.8 Deferred Taxes, net -5.2 Equity Method Investments 61.7 67.3 Other Investments and Deposits 1.41.6 Total Assets $438.0$375.7 Current Debt $ 15.2 $ 10.0 Total Current Liabilities37.2 24.6 Deferred Income 0.52.4 Long Term Debt - Non Recourse 107.7 69.0 Long Term Debt - Recourse 0.8 1.9 Total REX Equity (excludes non-controlling interests) $252.5 $244.9
Real Estate Assets • Previously built and operated 260-store consumer electronics chain • Discontinued retail operations in FY ’09 • Retail service contract deferred income recognized in discontinued operations • Monetized real estate as industry dynamics challenged retail operations • Reduced store count using disciplined financial criteria for each location • Sold 86 company-owned sites in 2007 for $74.5M in cash • Real estate holdings as of 1/31/12: • Carrying value $16.4M, net of $1.1M of debt • 22 owned store locations & 1 distribution center • Divesting real estate on an opportunistic basis
Ethanol plants and other industrial investments Share repurchases below book value ~4.0M shares repurchased last four years at average price of $13.47 Repurchased 1,305,589 shares in FY’11 at average price of $17.02 162,455 shares remaining under current repurchase authorization Capital Allocation Priorities
REX Summary • Successful alternative energy investor since 1998 • Interests in seven operating ethanol production facilities which sold ~669 million gallons (TTM) • REX effective ownership interest of TTM gallons sold = ~248 million gallons • Alternative energy segment profit of $48.6M in FY’11 vs. $13.4M in FY’10 • Industry leading ethanol production skill and plant efficiencies • REX ethanol operations are among best performing plants • Growth opportunities in ethanol and other industrial sectors • Expand ownership of existing facilities • Invest in new ethanol plants or industrial projects requiring similar skill sets • Proven management team with asset allocation discipline • 11.2% average ROE since 1993, despite low returns on high cash balances • Long-term program of share repurchases below book value • Insider ownership of ~33% • Strong asset base (at 1/31/12): • Shareholders‘equity $252.5M (~$30.06 share) • Unrestricted cash $46.1M • Net real estate value $16.4M • 8.4M diluted shares outstanding at 1/31/12
REX AMERICAN RESOURCES CORPORATION REX: NYSE www.rexamerican.com Investor Relations Contact: Joseph Jaffoni Jaffoni & Collins Incorporated 212/835-8500 or rex@jcir.com