Download
1 / 24
240 likes | 391 Views
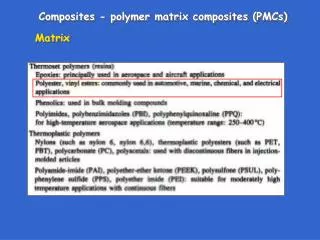
Mark Hervig GATS Inc., Driggs, Idaho. Polar Mesospheric Clouds (PMCs) and Water Vapor. Overview. -Introduction to polar mesospheric clouds (PMCs) -Connections between PMCs and atmospheric change -HALOE measurements in the polar mesosphere

E N D
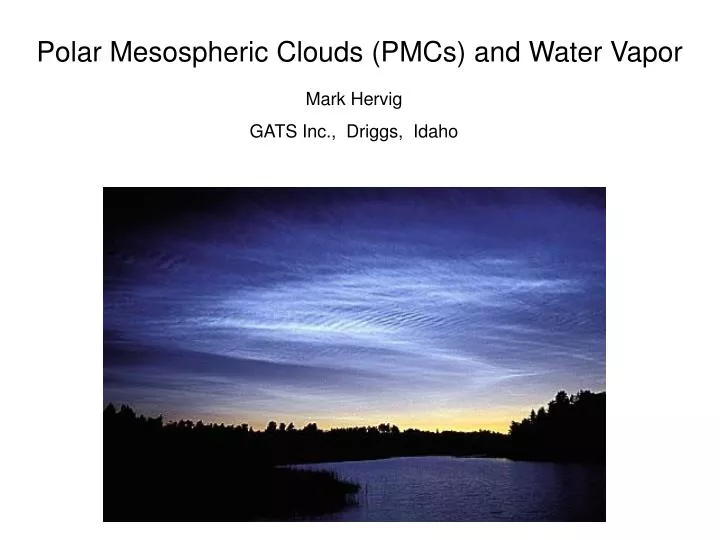
Mark Hervig GATS Inc., Driggs, Idaho Polar Mesospheric Clouds (PMCs) and Water Vapor
Overview -Introduction to polar mesospheric clouds (PMCs) -Connections between PMCs and atmospheric change -HALOE measurements in the polar mesosphere -The seasonal cycle in mesospheric water vapor, the role of PMCs PMCs are historically known as noctilucent (or “night-shinning”) clouds (NLCs)
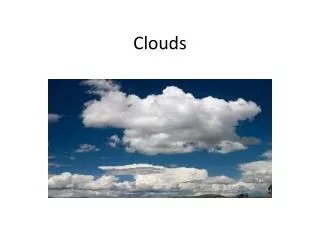
PMC Characteristics PMCs occur: -Poleward of 50 latitude, in both hemispheres -During summer -Near 83 km altitude PMCs are composed of water ice This was only recently confirmed by HALOE [Hervig et al., 2001] photo by Pekka Parviainen
PMCs (NLCs) are visible from the ground Shortly after sunset, the observer is in darkness, but the NLC is still in sun light NLC over Finland photo by Pekka Parviainen
PMC measurements In Situ Rockets Remote Ground observers: visual, cameras LIDAR Satellite: solar source, limb, nadir LIDAR
A Connection Between PMCs and Atmospheric Change • PMCs respond to atmospheric temperature and humidity Temperature is affected by carbon dioxide (CO2) Humidity is affected by methane (CH4): • CO2 and CH4 are increasing due to human activities • Increasing CO2: warms the troposphere, “greenhouse effect” cools the mesosphere • Increasing CH4: methane becomes water: CH4 + OH > CH3 + H2O • PMCs are therefore a visible indication of climate change “The minors canary” of climate change
PMC patterns are changing PMCs are occurring more often[Gadsen, 1997] occurring farther from the poles [Wickwar et al., 2002] getting brighter [Klostermeyer, 2002] Are these changes telling us something? NLC photo by Timo Leponiemi
Temporal Change From Gaddsen, 1997 NLCs occur nearly twice as often as they did 35 year ago
Spatial Change NLCs are occurring 700 miles farther south than ever before US Towns where NLCs were recently sighted: Twin Falls, Idaho Logan, Utah Boulder, Colorado Glen Ullin, North Dakota McGuire, New Jersey
Are changing PMC patterns related to climate? photo by Pekka Parviainen
Temperature in the Mesosphere is decreasing Temperatures near 80 km have cooled by almost 5 degrees Kelvin (K) every 10 years, since measurements were started in the 1950’s
Increasing Methane in the Atmosphere Some evidence suggests an increase in mesospheric H2O, but this is not yet clear.
The Halogen Occultation Experiment (HALOE) Measurements relevant to the polar mesosphere: -Particle extinction at 6 wavelengths (2.45, 3.40, 3.46, 5.26, 6.26 m) -Nitric oxide -Temperature -Water vapor T & H2O are adversely affected by PMC signals (we fixed that) Coverage of polar summer in both hemispheres 12 years of measurements, and still going…
PMC contamination was removed from HALOE temperature and water vapor retrievals Measured PMC extinction is extrapolated to the H2O and CO2 wavelengths using modeled PMC spectra, and then treated as an interfering absorber
Some HALOE sampling issues A synthetic PMC distribution The effects on trend analysis
The seasonal cycle in mesospheric H2O Vertical transport is one driver behind this change Microwave radiometer at ALOMAR, Norway 69N HALOE, 83 km 65 - 80N
The Seasonal Cycle in Mesospheric H2O A Relationship to PMCs ? Upwelling cannot account for observed enhancements Can PMC evaporation explain the seasonal increase in water vapor?
Analysis of HALOE PMC measurements PMC identification compare modeled ice spectrum to HALOE measurements Ice volume density (Vice) determined from HALOE extinctions () a fit to model calculations: Vice = A ()B The equivalent gas phase H2O contained in PMCs thermodynamics: H2O(ice) = Vice R* T ice / (P Mw)
Seasonal Cross Sections of HALOE Measurements and Some Derived Quantities Averages for 1992 – 2001, 65 – 80N
The observed H2O increase compared to the PMC contribution H2O increase since PMC onset
Averages of HALOE measurements during 1992 -2001 at 65 to 80N latitude The seasonal H2O increase compared to the H2O input from PMCs Measured vs. modeled PMC volume Early and late summer H2O
Seasonal Time Series PMC volume density water vapor
Conclusions Summer enhancement of mesospheric water vapor: Upwelling contributes at altitudes from 50 to 88 km PMC evaporation dominates from 83 to 88 km Upwelling explains enhancement from 50 to 70 km Enhancement at70 to 82 km is a mystery, some possibilities: measurement errors? Possible molecular diffusion? No eddy mixing? Inconsistent with secondary peak near 75 km H2 + O on meteoric dust? Perhaps [Summers and Siskind, 1999] PMC measurements vs. simulations: support the growth/sedimentation theory also suggest the possibility of in situ PMC formation By enhancing H2O, PMCs appear to be self-modifying