Download

1 / 29
290 likes | 302 Views
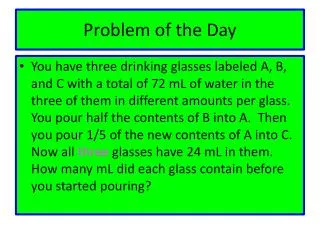
Warm Up. Problem of the Day. Problem of the Day. Lesson Presentation. Lesson Quizzes. Warm Up Jason deposits $200 in an account that earns 3.6% simple interest. How long until the total amount is $300?. Almost 14 years. Problem of the Day

E N D
Warm Up Problem of the Day Problem of the Day Lesson Presentation Lesson Quizzes
Warm Up Jason deposits $200 in an account that earns 3.6% simple interest. How long until the total amount is $300? Almost 14 years
Problem of the Day Books A, B, C, and D are on the bookshelf. A is between C and B. B is between A and D. D is not on the right. What is the order of the books from right to left? D, B, A, C
Sunshine State Standards Prep for MA.7.S.6.2 Construct and analyze…stem-and-leaf plots…
Vocabulary frequency table cumulative frequency stem-and-leaf plot line plot
Remember! The frequency of a data value is the number of times it occurs. A frequency table is a way to organize data into categories or groups. By including a cumulative frequency column in your table, you can keep a running total of the frequencies in each category.
February Temperatures in 20 Cities Cumulative Frequency Average Highs Frequency Additional Example 1: Organizing and Interpreting Data in a Frequency Table The list shows the average high temperatures for 20 cities on one February day. Make a cumulative frequency table of the data. How many cities had average high temperature below 59 degrees? 69, 66, 65, 51, 50, 50, 44, 41, 38, 32, 32, 28, 20, 18, 12, 8, 8, 4, 2, 2 Step 1: Choose a scale that includes all of the data values. Then separate the scale into equal intervals. 0–19 20–39 40–59 60–79
February Temperatures in 20 Cities Cumulative Frequency Average Highs Frequency Additional Example 1 Continued The list shows the average high temperatures for 20 cities on one February day. Make a cumulative frequency table of the data. How many cities had average high temperature below 59 degrees? 69, 66, 65, 51, 50, 50, 44, 41, 38, 32, 32, 28, 20, 18, 12, 8, 8, 4, 2, 2 Step 2: Find the number of data values in each interval. Write these numbers in the “Frequency” column. 0–19 7 20–39 5 40–59 5 3 60–79
February Temperatures in 20 Cities Cumulative Frequency Average Highs Frequency 0–19 7 5 20–39 40–59 5 3 60–79 Additional Example 1 Continued The list shows the average high temperatures for 20 cities on one February day. Make a cumulative frequency table of the data. How many cities had average high temperature below 59 degrees? 69, 66, 65, 51, 50, 50, 44, 41, 38, 32, 32, 28, 20, 18, 12, 8, 8, 4, 2, 2 Step 3: Find the cumulative frequency for each row by adding all the frequency values that are above or in that row. 7 12 17 20 17 cities had average high temperature below 59 degrees.
Check It Out: Example 1 The list shows the grades received on an English exam. Make a cumulative frequency table of the data. How many students received a grade of 79 or below? 85, 84, 77, 65, 99, 90, 80, 85, 95, 72, 60, 66, 94, 86, 79, 87, 68, 95, 71, 96
English Exam Grades Cumulative Frequency Grades Frequency Check It Out: Example 1 Continued 4 60–69 4 4 70–79 8 14 80–89 6 20 6 90–99 8 students received a 79 or below.
Stems Leaves 2 4 7 9 3 0 6 A stem-and-leaf plot uses the digits of each number to organize and display a set of data. Each leaf on the plot represents the right-hand digit in a data value, and each stem represents the reamining left-hand digits. Key:2|7 means 27
Additional Example 2: Organizing and Interpreting Data in a Stem-and-Leaf Plot The data shows the number of years coached by the top 15 coaches in the all-time NFL coaching victories. Make a stem-and-leaf plot of the data. Then find the number of coaches who coached fewer than 25 years. 33, 40, 29, 33, 23, 22, 20, 21, 18, 23, 17, 15, 15, 12, 17 Step 1: Order the data from least to greatest. Since the data values range from 12 to 40, use tens digits for the stems and ones digits for the leaves.
Stems Leaves Additional Example 2 Continued The data shows the number of years coached by the top 15 coaches in the all-time NFL coaching victories. Make a stem-and-leaf plot of the data. Then find the number of coaches who coached fewer than 25 years. 33, 40, 29, 33, 23, 22, 20, 21, 18, 23, 17, 15, 15, 12, 17 Step 2: List the stems from least to greatest on the plot. The stems are the tens digits. 1 2 3 4
Stems Leaves Additional Example 2 Continued The data shows the number of years coached by the top 15 coaches in the all-time NFL coaching victories. Make a stem-and-leaf plot of the data. Then find the number of coaches who coached fewer than 25 years. 33, 40, 29, 33, 23, 22, 20, 21, 18, 23, 17, 15, 15, 12, 17 Step 3: List the leaves for each stem from least to greatest. The stems are the tens digits. The leaves are the ones digits. 8 5 5 7 7 2 1 2 3 4 0 3 2 3 9 1 3 3 0
Stems Leaves 8 5 5 7 7 2 1 2 3 4 0 3 2 3 9 1 3 3 0 Additional Example 2 Continued Step 4: Add a key and a title. Number of Years Coached The stems are the tens digits. The leaves are the ones digits. Key: 2 | 1 means 21. 11 coaches coached fewer than 25 years.
Points Points Feb 7 36 Feb 25 18 Feb 14 34 Feb 27 31 Feb 18 27 Mar 1 43 Feb 20 46 42 Mar 4 Check It Out: Example 2 The table shows the number of points a player scored during the last ten games of the season. Make a stem-and-leaf plot of the data. In how many games did the player score less than 30 points? GameDate GameDate Mar 3 Feb 23 32 28
Stem Leaves Check It Out: Example 2 Continued 3 games under 30 points 1 2 3 4 8 7 8 1 2 4 6 2 3 6 Key: 1|8 means 18
M T W Th F S Su Wk 1 0 6 4 6 5 8 2 Wk 2 2 7 7 7 0 6 8 Wk 3 0 6 8 5 6 1 2 Wk 4 4 8 4 3 3 6 0 Additional Example 3: Organizing and Interpreting Data in a Line Plot Make a line plot of the data. How many hours per day did Morgan babysit most often? Number of Babysitting Hours in July
0 1 2 3 4 5 6 7 8 Additional Example 3 Continued Make a line plot of the data. How many hours per day did Morgan babysit most often? Step 1: The data values range from 0 to 8. Draw a number line that includes this range.
0 1 2 3 4 5 6 7 8 Additional Example 3 Continued Make a line plot of the data. How many hours per day did Morgan babysit most often? Step 2: Put an X above the number on the number line that corresponds to the number of babysitting hours in July. XXXXXX XXXX XXXX XXX XXX XXX XX XX X The greatest number of X’s appear above the number 6. This means that Morgan babysat most often for 6 hours.
6 7 8 9 10 Check It Out: Example 3 The hourly rates Morgan got for her last 10 jobs were $6, $6, $8, $7, $8, $9, $6, $10, $8, $6. Make a line plot of the data. What was the most common hourly rate? XXXX XXX X X X $6 per hour is the most common rate
Lesson Quizzes Standard Lesson Quiz Lesson Quiz for Student Response Systems
Nurses’ Ages Cumulative Frequency Ages Frequency 20–29 5 5 30–39 7 12 40–49 4 16 50–59 2 18 60–69 2 20 Lesson Quiz: Part I The data shows the ages of some hospital nurses. 33, 35, 23, 39, 23, 24, 34, 21, 57, 45, 57, 60, 45, 24, 31, 42, 61, 45, 35, 38 1. Make a cumulative frequency table of the data.How many of the nurses are under the age of 40? 12
Nurses’ Ages Stems Leaves 1 3 3 4 4 2 3 4 5 6 1 3 4 5 5 8 9 2 5 5 5 7 7 0 1 Lesson Quiz: Part II The data shows the ages of some hospital nurses. 33, 35, 23, 39, 23, 24, 34, 21, 57, 45, 57, 60, 45, 24, 31, 42, 61, 45, 35, 38 2. Make a stem-and-leaf plot of the data. How many nurses are over the age of 45? 4 Key: 4 | 2 means 42.
20-29 30-39 40-49 50-59 60-69 Lesson Quiz: Part III The data shows the ages of some hospital nurses. 33, 35, 23, 39, 23, 24, 34, 21, 57, 45, 57, 60, 45, 24, 31, 42, 61, 45, 35, 38 3. Make a line plot of the data. What age occurs most often? 45 XXXXXXX XXXXX XXXX XX XX
Lesson Quiz for Student Response Systems 1. The data shows the number of loaves of bread a bakery sold each day for a month. Identify a cumulative frequency table of the data. How many days did the bakery sell less than 30 loaves? 12, 19, 27, 24, 19, 44, 8, 32, 21, 37, 15, 6, 16, 48, 26, 5, 14, 23, 6, 35, 37, 28, 47, 40 A.B.
Lesson Quiz for Student Response Systems 2. The data shows the ages (in days) of puppies in a pet-care center. Identify a stem-and-leaf plot of the data. How many puppies were over the age of 20 days? 24, 35, 29, 27, 38, 19, 7, 31, 28, 36, 22, 19, 12, 31, 6, 18, 33, 26, 15, 32, 23, 19, 5, 11, 4 A.B.
Lesson Quiz for Student Response Systems 3. The data gives the shoe sizes of a group of students. Identify a line plot of the data. What shoe size occurs most often? 8, 8, 7, 6, 9, 9, 10, 13, 11, 10, 8, 9, 12, 10, 9, 9, 13, 12, 9, 8, 10, 7 A.B.