Download
1 / 51
520 likes | 757 Views
Using SPSS. Handy buttons. Switch between values & value labels. Info about variables (& ‘Go To’). Handy buttons. In dialog boxes you always have help nearbye…. Click with the right mouse button on a variable you want to know more about…. Handy buttons. … and you will get variable info….

E N D
Handy buttons Switch between values & value labels Info about variables (& ‘Go To’)
Handy buttons In dialog boxes you always have help nearbye… Click with the right mouse button on a variable you want to know more about…
Handy buttons … and you will get variable info…
SPSS output viewer Just let’s make a table with some corre-lations
SPSS output viewer Now, click with the right mouse button on table en choose Open…
SPSS output viewer … and you will get a new window wherein you can edit the table
SPSS output viewer Now, let’s look at the Pivoting Trays
SPSS output viewer The pivots of the table… This pivot represents the variables This pivot represents the variables This pivot represents the statistics
SPSS output viewer Now put the pivot of the statistics in the layer (‘capa’) and the form of the table will change!
SPSS Syntax In each dialogbox you will see a button Paste (‘Pegar’) to create syntax.
SPSS Syntax After having done Paste (‘Pegar’) you will see a ‘command’ in the syntax window.
SPSS Syntax You can as well open a specific syntax file, i.e. Ridge Regression (in the SPSS program folder)
SPSS Syntax Why would you use syntax??? • To do analyses repeatedly • To use all the functions of SPSS (in dialogboxes +/- 95% is incorporated) • To be independent of dialogboxes, that keep changing…(and syntax never changes)
SPSS Options Make your SPSS life easy with Edit | Options For instance by using the session journal file as a syntax file…
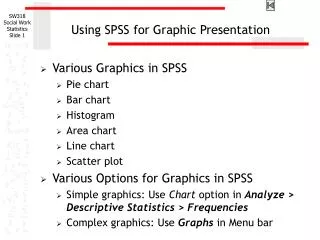
Regression revisited; topics: • Graphing relationships • Transforming variables • Missing Values • Outliers & Influential Points • Categorical predictors
Graphing Relationships Matrixplot to make a plot of a lot of variables
Graphing Relationships Specify variables
Graphing Relationships Result in output window
Graphing Relationships You can edit the Graph like you edited a table by opening the graph (click with right mouse button on the graph and choose Open)
Graphing Relationships Now choose Chart | Options
Graphing Relationships Then ask for a fit line
Graphing Relationships • Some remarks: • GDP is related in a non linear way with other variables • variable Aids Cases we have a very influential point (not an outlier, but influential!) • correlation between female life expectation and male life expectation is almost 1
Graphing Relationships Let’s try to transform gdp_cap in order to get linear relationships with other variables. First let’s look at the distribution of gdp_cap with a histogram: We need to bring values on the right closer to values on the left. We might try a LN transformation…
Transforming variables The histogram of transformed variable is:
Transforming variables Relationships are nicely linear !
Transforming variables Note: you probably want to make a variable lifeexp out of life expectancy males and life expectancy females: Tip: use function Mean in stead of using the ‘+’ and dividing by 2
Categorical Predictors Is income dependent on years of age and religion ?
Categorical Predictors Compute dummy variable for each category, except last
Categorical Predictors And so on…
Categorical Predictors Block 1
Categorical Predictors Block 2
Categorical Predictors Ask for R2 change
Categorical Predictors Look at R Square change for importance of categorical variable
Categorical Predictors Zodiac is actually a categorical variable
Categorical Predictors Indicator coding scheme
Annotated output of regression analysis (it uses the file data/elemapi.sav ) http://www.ats.ucla.edu/stat/spss/webbooks/reg/chapter1/annotated1.htm For more on regression, see: http://www.ats.ucla.edu/stat/spss/webbooks/reg/chapter1/spssreg1.htm
Outliers Saving residuals
Influential Points Saving distances and influence measures as variables
Multicollinearity Diagnostics