Download
1 / 14
140 likes | 272 Views
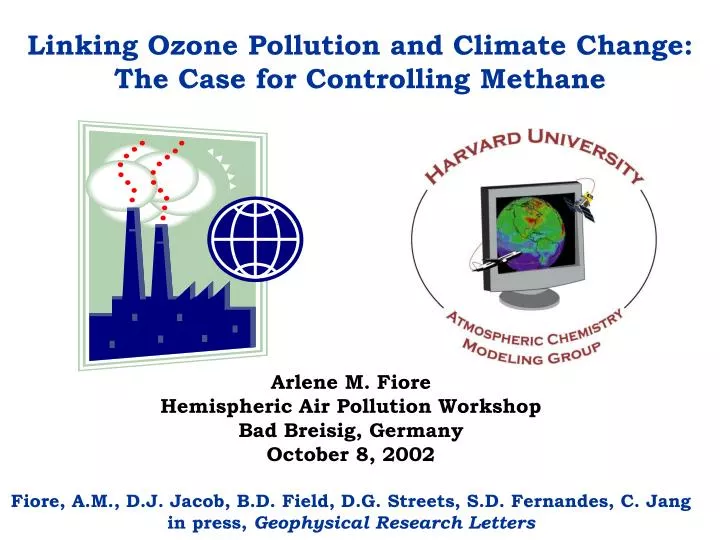
Linking Ozone Pollution and Climate Change: The Case for Controlling Methane. Arlene M. Fiore Hemispheric Air Pollution Workshop Bad Breisig, Germany October 8, 2002 Fiore, A.M., D.J. Jacob, B.D. Field, D.G. Streets, S.D. Fernandes, C. Jang in press, Geophysical Research Letters.

E N D
Linking Ozone Pollution and Climate Change: The Case for Controlling Methane Arlene M. Fiore Hemispheric Air Pollution Workshop Bad Breisig, Germany October 8, 2002 Fiore, A.M., D.J. Jacob, B.D. Field, D.G. Streets, S.D. Fernandes, C. Jang in press, Geophysical Research Letters
Tropospheric ozone links air pollution & climate change (1) primary constituent of smog in surface air [NRC, 1991] (2) 3rd most important greenhouse gas [IPCC, 2001] O3 Free Troposphere hn NO NO2 Global Background O3 OH HO2 Boundary layer (0-2.5 km) Intercontinental Transport VOC, CH4, CO Chemical loss Deposition NOx NMVOCs NOx NMVOCs O3 O3 CONTINENT 1 CONTINENT 2 OCEAN
U.S. ozone abatement strategies evolve as our understanding of the surface O3 problem improves O3 smog recognized as an URBAN problem:Los Angeles, Haagen-Smit identifies chemical mechanism Smog considered REGIONAL problem; role of biogenic VOCs discovered A GLOBAL perspective: role of intercontinental transport, background Present 1980s 1950s AbatementStrategy: NMVOCs + NOx + CH4??
QUESTION:Can we simultaneously mitigate air pollution and greenhouse warming? TOOL:GEOS-CHEM 3D Tropospheric Chemistry Model [Bey et al., 2001] (uses assimilated meteorology; 20 s; 4ºx5º or 2ºx2.5º horiz. resn.) MODEL EVALUATION: Mean July 1995 1-5 p.m. O3 (ppbv) in U.S. surface air Model Bias: 2 ppbv, r2 = 0.7 GEOS-CHEM captures: regional high-O3 episodes, observed O3vs. (NOy-NOx), observed tightening of O3 distribution from 1980 to 1995 [Fiore et al., JGR, August, 2002]
METHOD:Use GEOS-CHEM to conduct a series of sensitivity simulations with perturbed emissions • 1. Reduce various combinations of anthrop. emissions by 50% globally relative to 1995 base year • CH4 fixed at steady-state global uniform concentration • (1700 ppbv for 1995) What is the anthrop. contribution to global emissions? • NOx ~ 65% 33% • CO ~ 50% 25% • VOCs ~ 12% 6% • CH4 ~ 60% 30% Perturbations to total emissions when anthropogenic are halved ( 1000 ppbv)
METHOD (continued): 2. Implement IPCC A1/B1 future emission scenarios for 2030 A1 2030 Percent change in anthrop. emis. from 1995 base case to 2030 simulations: GLOBAL increase USA decrease CO CH4 NOx VOCs B1 2030
Change in radiative forcing* (W m-2) from O3and CH4 relative to 1995 base case NOx OH CH4 50% anthr. NMVOC 50% anthr. CH4 50% anthr. NOx 2030 A1 2030 B1 *calculated from changes in global CH4 concentrations [IPCC, 2001] and changes in the mean tropospheric O3 column [Mickley et al., 1999]
Change in summer afternoon O3 in surface air over the U.S. Relative to 1995 base year (mean 51 ppbv, background 23 ppbv) Mean O3 Background O3* Degradation of U.S. air quality from rise in global emissions despite domestic reductions Change in O3 (ppbv) 50% anthr. NMVOC 50% anthr. CH4 50% anthr. NOx 2030 A1 2030 B1 *produced outside the North American boundary layer (surface-760 hPa)
Impacts of Emissions Perturbations on U.S. Air Quality Number of summer grid-square days with O3 > 80 ppbv Increase in U.S. pollution events despite domestic decline in anthrop. emissions 50% anthr. VOC 50% anthr. CH4 50% anthr. NOx 2030 A1 2030 B1 1995 (base)
Rising emissions from developing countries lengthen the O3 pollution season in the United States 1995 Base Case 2030 A1
NOx NMVOCs Methane emissions reductions lower global O3 background and improve air quality everywhere Free Troposphere CH4 emissions global impact: Lower background O3 Negative radiative forcing CH4 Intercontinental transport, global O3 background increases in 2030 A1 simulation O3 Boundary layer (0-2.5 km) NOx emissions local impact; little effect on climate Chemical loss Deposition NOx NMVOCs O3 O3 CONTINENT 1 CONTINENT 2 OCEAN
IPCC Projections of Future Methane Emissions to 2050 900 Scenarios A1B A1T A1F1 A2 B1 B2 IS92a 800 CH4 emissions (Tg CH4) 700 600 2000 2040 2020 Year Can we aim to decrease CH4 emissions?
WHAT ARE TAGGED OZONE TRACERS? Standard Model: NOx + hydrocarbons POx (archive 24-hr avg rates) Tagged Tracer Model: O3(total) = O3(FT) + O3(NABL)+ O3(PacBL) + … Tropopause POx O3(FT) Free Troposphere ~3 km POx O3(PacBL) POx O3(NABL) Boundary Layer Boundary Layer Pacific Ocean North America Background= O3(FT) + O3(PacBL) + … = O3(total) - O3(NABL) (Ox = O3 + O + NO2 + 2NO3 + PANs + HNO4 + 3N2O5 + HNO3)
Number of summer grid-square days with O3 > 70 ppbv 500 400 Increase in U.S. pollution events despite domestic decline in anthrop. emissions 300 200 100 1995 (base) 50% anthr. NMVOC 50% anthr. CH4 50% anthr. NOx 2030 A1 2030 B1