Download
1 / 7
80 likes | 279 Views
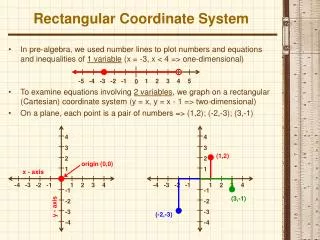
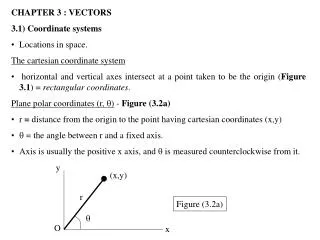
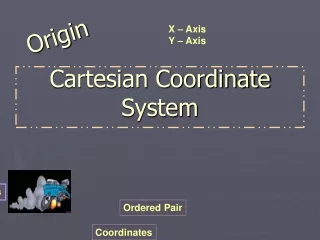
1.3 The Cartesian Coordinate System. The Cartesian Coordinate System. y-axis. have ordered pairs Cartesian = coordinate = rectangular system Soooo Review!. Quad I. II. the coordinate plane has coordinate axes (x & y). x-axis. origin. IV. III.

E N D
The Cartesian Coordinate System y-axis have ordered pairs Cartesian = coordinate = rectangular system Soooo Review! QuadI II the coordinate plane has coordinate axes (x & y) x-axis origin IV III *every point has a unique ordered pair (x, y) ordinate (image) abscissa (pre-image) • *you can create a “graph” by plotting coordinate pairs • *remember your axes don’t have to have the same scale – • use what works/fits best! • known pairs can help you estimate new pairs • knowing all pairs can help you estimate/get an equation
Ex 1) A toaster plant has an automated production line. x represents # of hours per day line functions and y number of toasters. Plot what you know and try to fill in the missing numbers in the chart. 1500 1250 maybe 800 maybe 1100 maybe 900 1000 750 500 250 0 3 6 9 12 15 18 21 24
(x-int is when y = 0 & y-int is when x = 0) *Graphing by finding intercepts is a convenient way to graph Or change graph to y = Ex 2) A mathematical model turns out to be 16x + y = 2150 • x & y-ints OR (2) y = –16x + 2150 2500 2000 1500 1000 500 0 60 20 40 80 100 120 140
y = x2 (basic parabola) y = x (basic line) y = x3 (basic cubic) *We can also utilize our graphing calculator & adjust the window if need be - Reminder Use y = ____, can try ZOOM Standard or ZOOM Fit or adjust window manually Not all eqtns have x’s & y’s!! So how do you know which letter correlates to the x-axis?!?! The letter that correlates to the x-axis is called the independent variable (y is the dependent variable)
Ex 3) Graph (q is the independent variable) 5( ) 400 350 300 250 200 150 0 20 40 60 80 100
Homework #103 Pg. 21 #1, 6, 9, 11, 13, 15, 18, 19, 21, 23, 27, 29, 32, 36, 45