Download
1 / 2
20 likes | 207 Views
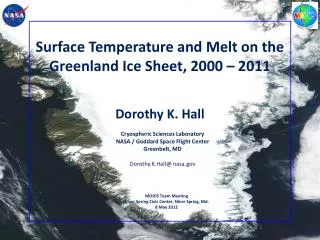
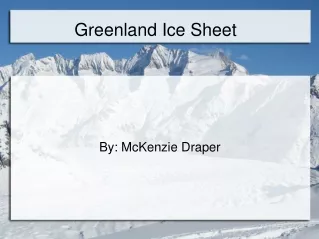
Greenland Ice-Surface Temperature (IST). Dorothy K. Hall, Cryospheric Sciences Branch, NASA/GSFC. MEaSUREs Project The EOS Moderate-Resolution Imaging Spectroradiometer (MODIS) snow and ice project has developed maps of Greenland ice-surface temperature (IST)

E N D
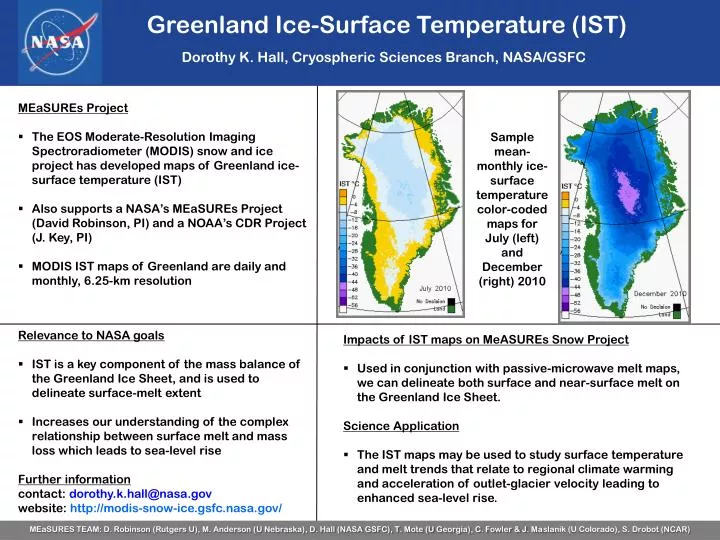
Greenland Ice-Surface Temperature (IST) Dorothy K. Hall, Cryospheric Sciences Branch, NASA/GSFC • MEaSUREs Project • The EOS Moderate-Resolution Imaging Spectroradiometer (MODIS) snow and ice project has developed maps of Greenland ice-surface temperature (IST) • Also supports a NASA’s MEaSUREs Project (David Robinson, PI) and a NOAA’s CDR Project (J. Key, PI) • MODIS IST maps of Greenland are daily and monthly, 6.25-km resolution Sample mean-monthly ice-surface temperature color-coded maps for July (left) and December (right) 2010 • Relevance to NASA goals • IST is a key component of the mass balance of the Greenland Ice Sheet, and is used to delineate surface-melt extent • Increases our understanding of the complex relationship between surface melt and mass loss which leads to sea-level rise • Further information • contact:dorothy.k.hall@nasa.gov • website:http://modis-snow-ice.gsfc.nasa.gov/ • Impacts of IST maps on MeASUREs Snow Project • Used in conjunction with passive-microwave melt maps, we can delineate both surface and near-surface melt on the Greenland Ice Sheet. • Science Application • The IST maps may be used to study surface temperature and melt trends that relate to regional climate warming and acceleration of outlet-glacier velocity leading to enhanced sea-level rise. MEaSURES TEAM: D. Robinson (Rutgers U), M. Anderson (U Nebraska), D. Hall (NASA GSFC), T. Mote (U Georgia), C. Fowler & J. Maslanik (U Colorado), S. Drobot (NCAR)
To develop the MODIS time series of the ice-surface temperature (IST) of the Greenland Ice Sheet, a great deal of quality control was done on the daily IST maps. The climate-data-record (CDR), from March 2000 to present, is a consistent and well characterized dataset that can be considered a “climate-quality data record,” (Hall et al., submitted) and will be elevated to the status of a CDR when at least 20 years of data from MODIS (Terra or Aqua) or Visible Infrared Imager Radiometer Suite (VIIRS) are available. The IST data record can be used to measure surface-temperature change over time and can also be used as input to models or for validation of model output. Though the record is currently only about 12 years long, seasonal “trends” have been measured. In all of the basins on the Greenland Ice Sheet, the IST is increasing during the winter (DJF) and decreasing in the fall (SON). The increase in IST is particularly noticeable in the northernmost and northeasternmost basins. This is consistent with results from model output. Melt extent can also be measured using the IST dataset. Use of the IST dataset over Greenland in conjunction with ground and other remotely-sensed data, will allow scientists to improve predictions of sea-level rise (SLR). SLR has major societal impacts, especially to coastal cities and countries for which the average elevation is very low.