Download
1 / 41
450 likes | 762 Views
Big-Data Tutorial. Marko Grobelnik marko.grobelnik@ijs.si Jozef Stefan Institute Ljubljana, Slovenia. Stavanger, May 8 th 2012. Outline. Introduction What is Big data? Why Big-Data? When Big-Data is really a problem? Techniques Tools Applications Literature. What is Big-Data?.

E N D
Big-Data Tutorial Marko Grobelnik marko.grobelnik@ijs.si Jozef Stefan Institute Ljubljana, Slovenia Stavanger, May 8th 2012
Outline • Introduction • What is Big data? • Why Big-Data? • When Big-Data is really a problem? • Techniques • Tools • Applications • Literature
What is Big-Data? • ‘Big-data’ is similar to ‘Small-data’, but bigger • …but having data bigger consequently requires different approaches: • techniques, tools & architectures • …to solve: • New problems… • …and old problems in a better way.
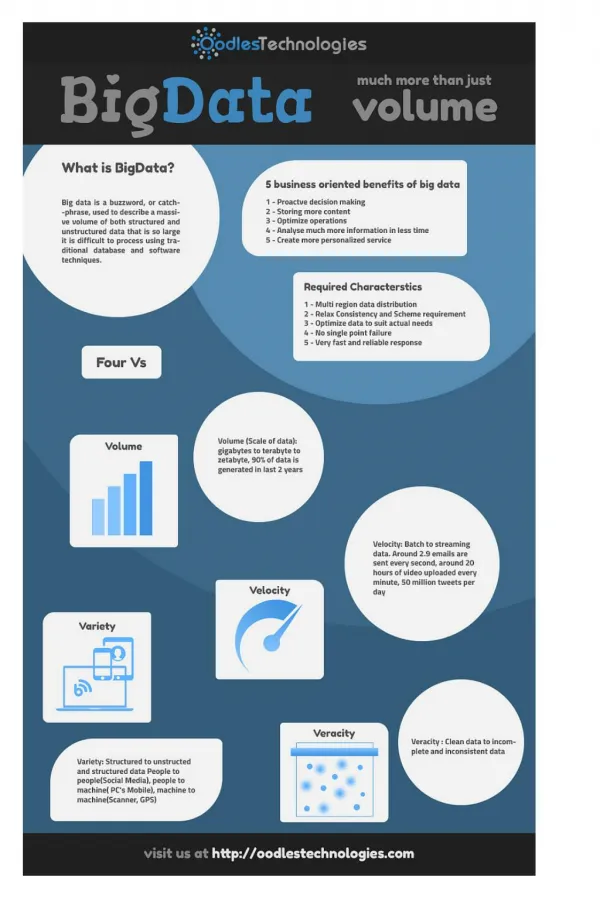
Characterization of Big-Data: volume, velocity, variety (V3) From “Understanding Big Data” by IBM
Big-Data in Gartner Hype-Cycle 2011 Big-Data
Why Big-Data? • Key enablers for the growth of “Big Data” are: • Increase of storage capacities • Increase of processing power • Availability of data
Tools typically used in Big-Data scenarios • NoSQL • DatabasesMongoDB, CouchDB, Cassandra, Redis, BigTable, Hbase, Hypertable, Voldemort, Riak, ZooKeeper • MapReduce • Hadoop, Hive, Pig, Cascading, Cascalog, mrjob, Caffeine, S4, MapR, Acunu, Flume, Kafka, Azkaban, Oozie, Greenplum • Storage • S3, Hadoop Distributed File System • Servers • EC2, Google App Engine, Elastic, Beanstalk, Heroku • Processing • R, Yahoo! Pipes, Mechanical Turk, Solr/Lucene, ElasticSearch, Datameer, BigSheets, Tinkerpop
When Big-Data is really a hard problem? • …when the operations on data are complex: • …e.g. simple counting is not a complex problem • Modeling and reasoning with data of different kinds can get extremely complex • Good news about big-data: • Often, because of vast amount of data, modeling techniques can get simpler (e.g. smart counting can replace complex model based analytics)… • …as long as we deal with the scale
What matters when dealing with data? Additional Issues • Research areas (such as IR, KDD, ML, NLP, SemWeb, …) are sub-cubes within the data cube Usage Quality Context Dynamicity Scalability Collect Prepare Data Modalities Text Signals Ontologies Networks Represent Structured Multimedia Model Reason Visualize Data Operators
…an example: recommendation @Bloomberg.com • Good recommendations can make a big difference when keeping a user on a web site • …the key is how rich context model a system is using to select information for a user • Bad recommendations <1% users, good ones >5% users click Contextual personalized recommendations generated in ~20ms
Each click on the web site is enriched and indexed using: • Domain • Sub-domain • Page URL • URL sub-directories • Page Meta Tags • Page Title • Page Content • Named Entities • Has Query • Referrer Query • Referring Domain • Referring URL • Outgoing URL • GeoIP Country • GeoIP State • GeoIP City • Absolute Date • Day of the Week • Day period • Hour of the day • User Agent • Zip Code • State • Income • Age • Gender • Country • Job Title • Job Industry
Application: Online Advertising for NYTimes (microtrends detection) Trend Detection System User profiles Log Files (~100M page clicks per day) Stream of clicks Stream of profiles Content Sales Trends and updated segments Segments NYT articles Campaign to sell segments $ Advertisers
Figures for one day of NYTimes • 50Gb of uncompressed log files • 10Gb of compressed log files • 0.5Gb of processed log files • 50-100M clicks • 4-6M unique users • 7000 unique pages with more then 100 hits • Index size 2Gb • Pre-processing & indexing time • ~10min on workstation (4 cores & 32Gb) • ~1hour on EC2 (2 cores & 16Gb)
Applications: Telecommunication Network Monitoring • Alarms Explorer Server implements three real-time scenarios on the alarms stream: • Root-Cause-Analysis – finding which device is responsible for occasional “flood” of alarms • Short-Term Fault Prediction – predict which device will fail in next 15mins • Long-Term Anomaly Detection – detect unusual trends in the network • …system is used in British Telecom Alarms Server Telecom Network (~25 000 devices) Alarms ~10-100/sec Alarms Explorer Server Live feed of data Analysis of data Top predictions Operator Big board display
Analysis of MSN-Messenger Social-network • Presented in “Planetary-Scale Views on a Large Instant-Messaging Network” by Jure Leskovec and Eric Horvitz WWW2008
Instant Messenger – Phenomena at a planetary scale • Observe social and communication phenomena at a planetaryscale • Largest social network analyzed to date Research questions: • How does communication change with user demographics (age, sex, language, country)? • How does geography affect communication? • What is the structure of the communication network?
Data statistics: Total activity • We collected the data for June 2006 • Log size: 150Gb/day (compressed) • Total: 1 month of communication data: 4.5Tb of compressed data • Activity over June 2006 (30 days) • 245 million users logged in • 180 million users engaged in conversations • 17,5 million new accounts activated • More than 30 billion conversations • More than 255 billion exchanged messages
Geography and communication • Count the number of users logging in from particular location on the earth
How is Europe talking • Logins from Europe
Network: Small-world • 6 degrees of separation [Milgram ’60s] • Average distance between two random users is 6.6 • 90% of nodes can be reached in < 8 hops