Download
1 / 1
10 likes | 104 Views
ChesROMS : a ROMS-based Community Model for the Chesapeake Bay. Wen Long ( wenlong@hpl.umces.edu ), Raleigh Hood, Jiangtao Xu (UMD) Lyon Lanerolle, Thomas Gross (NOAA), Raghu Murtugudde, Chris Brown (UMD). River.

E N D
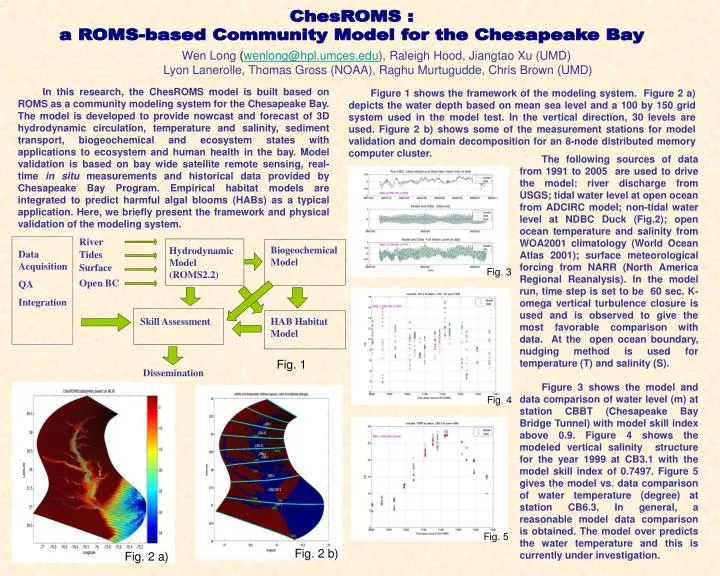
ChesROMS : a ROMS-based Community Model for the Chesapeake Bay Wen Long (wenlong@hpl.umces.edu), Raleigh Hood, Jiangtao Xu (UMD) Lyon Lanerolle, Thomas Gross (NOAA), Raghu Murtugudde, Chris Brown (UMD) River In this research, the ChesROMS model is built based on ROMS as a community modeling system for the Chesapeake Bay. The model is developed to provide nowcast and forecast of 3D hydrodynamic circulation, temperature and salinity, sediment transport, biogeochemical and ecosystem states with applications to ecosystem and human health in the bay. Model validation is based on bay wide satellite remote sensing, real-time in situ measurements and historical data provided by Chesapeake Bay Program. Empirical habitat models are integrated to predict harmful algal blooms (HABs) as a typical application. Here, we briefly present the framework and physical validation of the modeling system. Figure 1 shows the framework of the modeling system. Figure 2 a) depicts the water depth based on mean sea level and a 100 by 150 grid system used in the model test. In the vertical direction, 30 levels are used. Figure 2 b) shows some of the measurement stations for model validation and domain decomposition for an 8-node distributed memory computer cluster. Biogeochemical Model Hydrodynamic Model (ROMS2.2) Data Acquisition QA Integration Tides Surface Open BC The following sources of data from 1991 to 2005 are used to drive the model: river discharge from USGS; tidal water level at open ocean from ADCIRC model; non-tidal water level at NDBC Duck (Fig.2); open ocean temperature and salinity from WOA2001 climatology (World Ocean Atlas 2001); surface meteorological forcing from NARR (North America Regional Reanalysis). In the model run, time step is set to be 60 sec. K-omega vertical turbulence closure is used and is observed to give the most favorable comparison with data. At the open ocean boundary, nudging method is used for temperature (T) and salinity (S). Figure 3 shows the model and data comparison of water level (m) at station CBBT (Chesapeake Bay Bridge Tunnel) with model skill index above 0.9. Figure 4 shows the modeled vertical salinity structure for the year 1999 at CB3.1 with the model skill index of 0.7497. Figure 5 gives the model vs. data comparison of water temperature (degree) at station CB6.3. In general, a reasonable model data comparison is obtained. The model over predicts the water temperature and this is currently under investigation. Skill Assessment HAB Habitat Model Dissemination Fig. 3 Fig. 1 Fig. 4 Fig. 5 Fig. 2 b) Fig. 2 a)