Download
1 / 25
250 likes | 451 Views
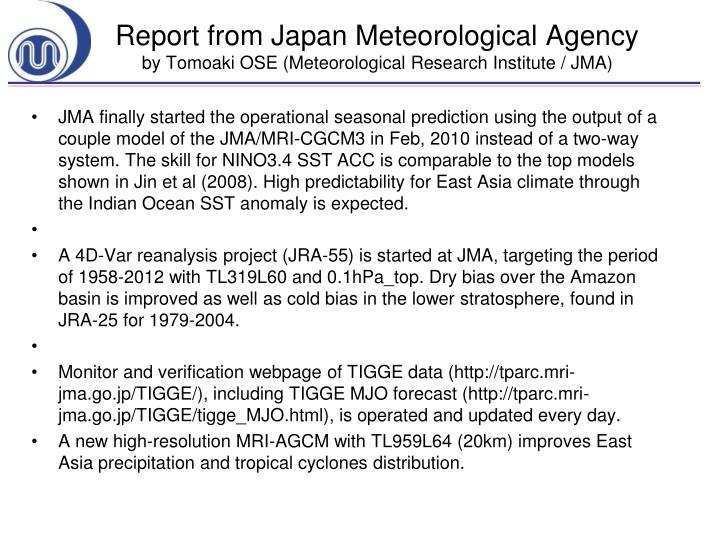
Report from Japan Meteorological Agency by Tomoaki OSE (Meteorological Research Institute / JMA).

E N D
Report from Japan Meteorological Agencyby Tomoaki OSE (Meteorological Research Institute / JMA) • JMA finally started the operational seasonal prediction using the output of a couple model of the JMA/MRI-CGCM3 in Feb, 2010 instead of a two-way system. The skill for NINO3.4 SST ACC is comparable to the top models shown in Jin et al (2008). High predictability for East Asia climate through the Indian Ocean SST anomaly is expected. • A 4D-Var reanalysis project (JRA-55) is started at JMA, targeting the period of 1958-2012 with TL319L60 and 0.1hPa_top. Dry bias over the Amazon basin is improved as well as cold bias in the lower stratosphere, found in JRA-25 for 1979-2004. • Monitor and verification webpage of TIGGE data (http://tparc.mri-jma.go.jp/TIGGE/), including TIGGE MJO forecast (http://tparc.mri-jma.go.jp/TIGGE/tigge_MJO.html), is operated and updated every day. • A new high-resolution MRI-AGCM with TL959L64 (20km) improves East Asia precipitation and tropical cyclones distribution.
Performance of JMA atmosphere-ocean coupled model Kiyotoshi Takahashi Climate Prediction Division/Japan Meteorological Agency
1. Introduction Flow of models for seasonal forecast and El-Niño outlook El-Niño prediction model JMA-CGCM A:T42L21 O:2.5x(0.5-2.0) M6(LAF) Aug.1999 JMA-CGCM02 A:T42L40 O:2.5x(0.5-2.0) M6(LAF) Jul.2003 JMA/MRI-CGCM A:TL95L40 O:1.0x(0.3-1.0) M12(LAF) Feb.2008 JMA/MRI-CGCM A:TL95L40 O:1.0x(0.3-1.0) M30(5m,LAF) Feb.2009 JMA/MRI-CGCM A:TL95L40 O:1.0x(0.3-1.0) M51(9m,LAF) Feb.2010 SST AGCM TL95L40M51 Sep.2007 AGCM T63L40M31 Mar.2003 AGCM TL95L40M31 Mar.2006 Seasonal forecast model Current system
NINO.3.4 SST ACC: dependency on lead time(quote from Fig. 8 of Jin et al. 2008) Initial: February (1980-2001) Initial: August (1980-2001) 1.0 0.8 0.6 0.4 0.2 0.0 1.0 0.8 0.6 0.4 0.2 0.0 0 1 2 3 4 5 0 1 2 3 4 5 (JMA/MRI-CGCM) Lead time (month) Lead time (month) NINO.3.4 region: 120W-170W, 5S- 5N Jin E. K., James L. Kinter III, B. Wang, C.-K. Park, I.-S. Kang, B. P. Kirtman, J.-S. Kug, A. Kumar, J.-J. Luo, J. Schemm, J. Shukla and T. Yamagata, 2008: Current status of ENSO prediction skill in coupled ocean–atmosphere models. Clim. Dyn., 31, 647–666.
Impact of IOBW on world climate (JJA) Impact of above-normal IOBW on world climate in boreal summer When above-normal IOBW SST persists through post-El Niño summer, impacts like theright panel are expected. Expectedatmospheric responses to warmer anomaly in IOBW SST. (Kelvin wave) Ref. Xie .et al(2009)
3. Comparison of performance SST between current and New systems SST prediction by new EPS system Comparison of monthly SST ACC Prescribed SST for current 2-tier system SST ACC for Dec.(4 month lead), Initial: the last day of July SST ACC (1084-2005) SST ACC (1084-2005) Anomaly correlation improvement improvement Lead time (month) Lead time (month) Northern Indian Ocean Tropical Western Pacific
3. Comparison of performance precipitation ACC: dependency on lead time (average for 4 initials) Precip. ACC 3 month mean (1984-2005) Precip. ACC 3 month mean (1984-2005) ☺ ☹ Lead time Lead time Indian monsoon area North Western Pacific monsoon are
Ensemble method for New EPS system 4. Summary • 9 members per 1 initial, 13 months forecast • Execution by every 5 day→LAF.LAF for a month • 6 initials→51members are used for one-month forecast -25day 51 members from 6 initial dates 1 initial date 9 members 0day
South China Flood in June 2010 Yuhei Takaya (JMA/CPD) ytakaya@met.kishou.go.jp
Precipitation in June 2010 (ratio to normals) Zhejiang 174 % Fuzhou 157 % Based on CLIMAT reports
June 2010 forecasts (init:May) precipitation anomaly Beijing ECMWF ExeterMelbourne Melbourne Montreal Moscow SeoulTokyo Tokyo (mm/day) Observation; OLR anomaly (original data are provided by NOAA) Toulouse Washington For details, please refer to the WMO LC website http://www.wmolc.org/
JRA-55the Japanese 55-year reanalysis project- status and plan - Ayataka Ebita, Yukinari Ota, Shinya Kobayashi*, Masami Moriya, Ryouji Kumabe, Kiyotoshi Takahashi and Kazutoshi Onogi Japan Meteorological Agency
Soil wetness in the root layer(Oct 1990 ~ Sep 1991) JRA-25 JRA-55 JRA-55 minus JRA-25 (Saturation ratio [0~1]) (Saturation ratio [0~1]) (Saturation ratio)
6-hour precipitation and surface pressure increment(Oct 1990 ~ Sep 1991) JRA-25 JRA-55 Exp Difference from GPCP precipitation (mm/day) Difference from GPCP precipitation (mm/day) Surface pressure increment (hPa/day) Surface pressure increment (hPa/day) The dry bias over the Amazon basin is likely due to an artificial anticyclonic anomaly caused by bias of surface pressure observations and the consequent lack of precipitation.
Summary JRA-55 improves upon JRA-25 in many respects, a longer reanalysis period, extending back in 1958, much better forecast performance than JRA-25, significantly reduced cold bias in the lower stratosphere, and reduced dry bias over the Amazon basin. Quality of analysis changes inevitably due to changes in observing systems, but there is a good prospect that a reasonably homogeneous analysis will be produced in the northern hemisphere troposphere. Quality of analysis is reasonablely high over the regions that radiosondes cover even if no satellite data is available. On the other hand, it is anticipated that analyses of the pre-satellite era would degrade seriously in the southern hemisphere troposphere.
Summary (cont.) There is a considerable possibility that quality of analysis in the pre-satellite era will improve by tuning the background error. An experiment with a global constant scaling factor showed a small but positive result in the southern hemisphere. The JRA-55 production is planned to start in Jun 2010 and expected to complete by early 2013.
Use of TIGGE data THORPEX Interactive Grand Global Ensemble The Observing System Research and Predictability Experiment under WWRP To improve the accuracy of 1-day to 2 week high-impact weather forecasts Ensemble forecast data from 10 global NWP centers
TIGGE: THORPEX Interactive Grand Global Ensemble http://tparc.mri-jma.go.jp/TIGGE/
TIGGE: THORPEX Interactive Grand Global Ensemble http://tparc.mri-jma.go.jp/TIGGE/tigge_MJO.html
Asian Summer Monsoon(JJA) 20km TRMM JRA CMAP Lines:Height Thickness (200hPa-500hPa) Shade: Precipitation Arrows: 850hPaWind NEW Seasonal Change of East Asia Precip Previous
Variability of Tropical Precipitation (JJA) 20km EOF1 EOF2 GPCP NEW Previous
Present climate simulation of TC formation &tracking distribution by 20km Atmos. Model (25 years) :Observation :Earlier model :Updated model 観測 前期モデル 後期モデル Overestimating Considerably improving Improving Improving a little Tendency of formation at more eastern locations Improving Improving
Western North Pacific Observation(1979-2003) 20km Updated Model (1979-2003) 20km Earlier Model(1979-2003) Blue :January - March Green:April- June Red:July-September Orange:October - December ※TC detection is adjusted so that total global number of formations is equal to that of observed number