Download
1 / 33
330 likes | 480 Views
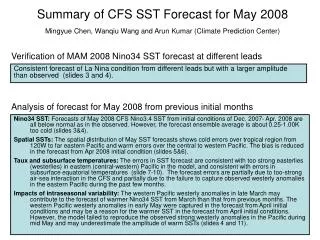
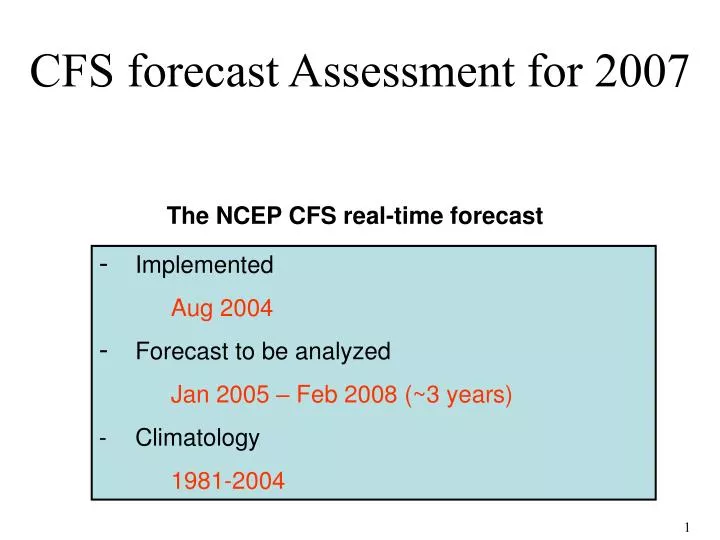
CFS forecast Assessment for 2007. The NCEP CFS real-time forecast. Implemented Aug 2004 Forecast to be analyzed Jan 2005 – Feb 2008 (~3 years) - Climatology 1981-2004. Related questions. - Is the forecast skill consistent with the hindcast skill?

E N D
CFS forecast Assessment for 2007 The NCEP CFS real-time forecast • Implemented • Aug 2004 • Forecast to be analyzed Jan 2005 – Feb 2008 (~3 years) - Climatology 1981-2004
Related questions - Is the forecast skill consistent with the hindcast skill? - Is there any systematic error during the forecast period? - How does the forecast skill compare with AMIP runs? - How does the MJO impact ENSO forecast? - ….
Outline Forecast assessment (Jan 2005 – Feb 2008) • SST, precipitation, T2m, Z200 • Mean forecast errors • Comparison with AMIP runs Analysis of Nino34 SST forecast • Impacts of intraseasonal variability
Climatology Old climatology 1981-2004 from standard CFS hindcast runs New climatology1981-1990 from corrected runs, 1991-2004 from standard runs Great help from Lindsey, Soo-Hyun, Hui
Impact of model climatology 20S-20N anomaly correlation Z200, Jan 2005 – Jul 2007 average, 2-mo-lead forecast
Forecast assessment • SST in the tropics
Pacific SST indices • Better forecast towards the west • Delayed transitions between warm and cold phases; forecast failed for 2007 La Nina (Nino12, 3, 34)
Indian Ocean SST indices • Better forecast for WTIO than ETIO • More realistic DMI forecast for 2007 and 2006 than 2005
Atlantic SST indices • Weaker warm anomalies for TNA in 2005/2006. • Low skill for TSA, TNA-TSA, ATL3
SST temporal correlation 1-mo lead • Better forecast in the tropical central Pacific and tropical western Atlantic • Western Indian Ocean is more predictable than eastern Indian Ocean
Tropical (20S-20N) anomaly correlation 1-mo lead • Precipitation skill generally follows SST skill • Better SST forecast toward the end of 2007
Forecast assessment • Correlation skill (T2m, precipitation, and z200 )
Pattern correlation 1-mo lead Land T2m Land Precipitation Z200 20S-20N 20S-20N 20S-20N 0.85 0.16 0.40 0.33 PNA NA NA 2005 2006 2007 2008 2005 2005 2006 2006 2007 2007 2008 2008 Nino34 SST (K) • Low precipitation skill • Higher skill in the tropics for Z200 and T2m • Low T2m skill over North America during northern fall • Better T2m may not correspond to better Z200 • Small Nino34 SST amplitude during most of the period
Pattern correlation Forecast with 1981-2004 hindcast skill mask 1-mo lead 0-mo lead 0.15 0.26 0.23 0.11 0.19 0.22 NA Prec 0.08 0.18 0.30 -0.05 0.10 0.25 NA T2m 0.34 0.38 0.50 0.24 0.37 0.49 PNA Z200 NA precipitation NA T2m PNA Z200 • Forecast skill is consistent with hindcast skill: Good forecast over areas where hindcast skill is high • Hindcast statistics are useful to determine forecast reliability
NDJ 2006/2007 T2m forecast from Sep 2006 Cor=0.90 Cor=-0.1 Cor=0.96 • The hindcast skill mask helps
Forecast assessment • Mean errors for the whole forecast period
2-month-lead forecast, Jan 2005 – Feb 2007 average T2m (K) SST (K) Z200 (m) • Cold T2m bias • These errors may be related to the lack of • increasing greenhouse gases • realistic sea ice coverage
Zonal mean land T2m (K), 2-month-lead forecast Jan 2005 – Feb 2007 average
Forecast assessment • Comparison with AMIP runs
Forecast vs AMIP: seasonal-mean correlation T2m 30S-30N land AMIP=0.375 CFS-1=0.431 CFS-0=0.450 30N-90N land AMIP=0.230 CFS-1=-0.035 CFS-0=0.075 Forecast vs AMIP: (1) better land surface/atmosphere initial condition (2) air-sea interaction (3) cold bias (lack of CO2 warming, sea-ice change)
Summary of Forecast assessment • Tropical SSTs • CFS tends to delay ENSO phase transition • Better skill in central Pacific than far EPAC and far WPAC • Better skill in the west than in the east for Indian and Atlantic Oceans • Forecast of Precipitation, T2m and Z200 • Hindcast skill mask is useful for reliable forecast • Forecast contains systematic cold bias during the recent years.
Analysis of Nino34 SST forecast • Impacts of intraseasonal variability • 2007-2008 La Nina • Demise of 2006-2007 El Nino • …
MJO Activity 200 mb velocity potential, 5S-5N average One strong MJO event in Dec-Jan 2006/2007 Weaker intraseasonal activities Feb-May 2007 Strong MJO of 2+ cycles in Nov-Feb 2007/2008
10S-10N U850 (m/s) Nino34 SST (K) 26 Nov 2007-21 Dec 2007 22 Dec 2007-16 Jan 2008 2007-2008 La Nina forecast strongly depends on the MJO phase in initial conditions.
Analysis of Nino34 SST forecast • Impacts of intraseasonal variability • 2007-2008 La Nina • Demise of 2006-2007 El Nino
Nino34 SST (K) • CFS tends to prolong and enhance existing anomalies • Dramatic change from Nov to Dec 2006
10S-10N OLR (W/m^2) 10S-10N U850 (m/s) • Easterly anomalies associated with the MJO in WPAC after 11 Dec 2006. • Easterly anomalies in central-eastern Pacific (180-150W) around 11 Dec 2006.
Nino34 SST (K) • Substantial change in forecast from Dec 1-5 to Dec 6-10
10S-10N U850 (m/s) Nino34 SST (K) Ensemble mean Substantial change in forecast from Dec 1-5 to Dec 6-10
Nino34 SST (K) Uncoupled MOM3 initialized 10 Dec 2006
MJO impacts on 2006-2008 ENSO events • The MJO has strong impacts on • The demise of 2006-2007 El Nino • The Evolution of the 2007-2008 La Nina • Forecast of the ENSO events • The MJO is not predictable by CFS beyond 10 days. Impacts of MJO events that occur 10 days after forecast starts will not be captured by the model • MJO Impacts on ENSO forecast depend on the phase of the MJO at the initial time. • For 2006-2007 El Nino, forecast became successful after the Dec 2006 – Jan 2007 MJO information was included in the initial conditions. • The MJO during Nov 2007 – Feb 2008 was strong and went through 2+ cycles, making the detailed evolution of the La Nina more difficult for predict.