Download
1 / 46
460 likes | 559 Views
Close the Assessment Loop; Give common questions, Analyze, and Discuss. April 19, 2013. Would you like your students to go from 58% to 70% mastery on a particular topic? Are you willing to try _____ to achieve similar results?. Introduction. Bill Robinson Associate Professor, Mathematics

E N D
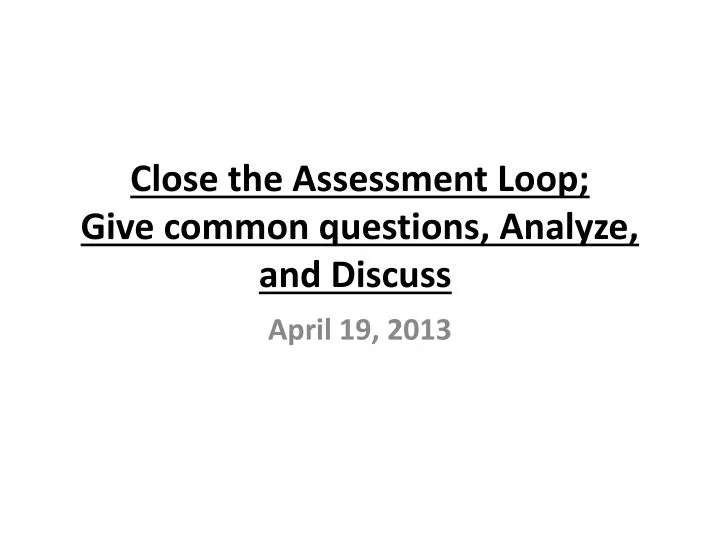
Close the Assessment Loop; Give common questions, Analyze, and Discuss April 19, 2013
Would you like your students to go from 58% to 70% mastery on a particular topic? Are you willing to try _____ to achieve similar results?
Introduction Bill Robinson Associate Professor, Mathematics Johnson County CC Overland Park, KS
Introduction Caroline Goodman Assistant Professor, Mathematics Johnson County CC Overland Park, KS
Assessment Cycle from JCCC Assessment Guide
Where in the cycle do you get “stuck”? • Question • Plan • Collect & Score • Analyze & Discuss • Act & Report • Starting!
Keys to Closing the Loop! “How to Get Started and Keep Moving!” • Discussion is critical • Pick a course with more faculty • Use professional development time • Make a Plan • Start small • Make it easy • Choose something you’re interested in
Three Initiatives • MATH 115 Elementary Algebra • 500+ students, 40+ sections, faculty • MATH 116 Intermediate Algebra • 600+ students, 40+ sections, faculty • MATH 181 Statistics • 300+ students, 15+ sections, faculty
Consider “The Cycle” for JCCC MATH 115 – Elementary Algebra This is where our cycle begins with Common Core questions
So What are “Common Core Questions”? • Identified as important competencies for the course • A subset of the final exam • Not a separate test • Embedded assessment tool • Enables course level assessment • Data is collected every three years
Math 115 Elementary AlgebraCommon Core Questions: • Solve a linear inequality • Simplify an exponential expression • Factor (difference of 2 squares) • Graph a line stated in standard form • Simplify a radical expression • Solve a quadratic equation (factorable) • Solve R*T=D problem
“The Cycle”MATH 115 – Elementary Algebra Spring 2000
“The Cycle” MATH 115 – Elementary Algebra Spring 2000 Spring 2003
“The Cycle” MATH 115 – Elementary Algebra Spring 2000 Spring 2003 Spring 2006
Keys to Closing the Loop! Or “How to Keep Moving!” • Focus on ONE Objective
Which concept would you choose to work on? • Concept that has very low success • Concept that has medium success • Concept that has somewhat high success • Other
“The Cycle” MATH 115 – Elementary Algebra Fall 2009 and Spring 2010 Data
Keys to Closing the Loop! Or “How to Keep Moving!” • Focus on ONE Objective • Need dedicated time
Where dedicated time came from: • Division Meetings • dedicated time during meetings • JCCC Office of Outcomes Assessment • coordinates the assessment efforts at our college • Sheri Barrett, Director, Outcomes Assessment • World Café discussions • mini-grants were offered to faculty
Faculty discussion #1 • Discussed the data • Look at overall numbers to see strength & weaknesses • Also presented data anonymously by section • Look for differences without being judgmental
Once the data is analyzed, you will know exactly what to do. • Fact • Myth
Faculty discussion #2 • Mini-grant retreat • Interested full-time and adjunct faculty met in Fall 2010
At this retreat, several questions were discussed, including: • What item consistently showed poor results on the students’ final exams? • In order to do well in subsequent math courses, what item do students need to learn or master? • How could we help the students learn this material better?
A topic was chosen: graphing lines • How do different instructors teach this topic? • Which methods/strategies hold promise? • Discussed mastery testing as an instructional strategy to provide spaced repetition • How do we tell if our plan (for improving their learning) is working?
Keys to Closing the Loop! Or “How to Keep Moving!” • Focus on ONE Objective • Need dedicated time • Need a team • Champion/owner • Data Person • Cheerleader(s)
“The Cycle” MATH 115 – Elementary Algebra A New Cycle begins
What is the Graphing Mastery Test? • Three different formats • Students must show “mastery” • Multiple attempts allowed • Within a specified time frame • Each instructor can decide if their class will participate. • A few instructors volunteered to test this Fall 2010; unveiled to everyone in Spring 2011.
“The Cycle” MATH 115 – Elementary Algebra Fall 2011 Fall 2010 Summer Fall 2010 2011 Spring 2011
Percent correct on Final Exam graphing question for 115 classes • Spring 2000 52% • Spring 2003 35% • Spring 2006 69% • Spring 2009 68% ---------Mastery Test initiated Spring 2011-----------
Percent correct on Final Exam graphing question for 115 classes • Spring 2000 52% • Spring 2003 35% • Spring 2006 69% • Spring 2009 68% ---------Mastery Test initiated Spring 2011----------- • Spring 2011 60% • Spring 2012 65% • Fall 2012 73%
Percent correct on Final Exam graphing question for 115 classes • Spring 2000 52% • Spring 2003 35% • Spring 2006 69% • Spring 2009 68% ---------Mastery Test initiated Spring 2011----------- • Spring 2011 60% (67% if mastery offered) • Spring 2012 65% (74% if mastery reached) • Fall 2012 73% (79% if mastery reached)
Subsequent Course results • IntermediateAlgebra “Write an equation of the line passing through 2 given points.” • Fall 2009 38% correct -----Mastery Test initiated Spring 2011----- • Fall 2012 61% correct
Questions? • Before we briefly discuss other initiatives, do you have any questions about the Math115 cycle?
Other Initiatives • Math 116, Intermediate Algebra • Gathering data “forever” • Held a discussion with adjunct faculty in Jan 2013 • What methods were working for other faculty?
MATH 181 Statistics • Historical Data • Discussion • Division Meeting • World Café • Mini-retreat • Focus on CLT • Tried an intervention • Completed cycle • Current Status
Statistics Professors Investigate Student Learning of the Sampling Distribution Concept Student Learning Outcome #5 Research Question Faculty Engagement Data Results Spring 2012 Statistics Professors were informed of the embedded question data collection plan through multiple emails. The plan was also announced and explained during an evening Statistics meeting that was made possible through an Outcomes Assessment Mini Grant. The percentage of students who answered the embedded question correctly during the Spring 2012 semester was remarkably higher than the percentage had historically been on the Final Exam question. The percentage of students who answered the Sampling Distribution question on the Spring 2012 Final Exam was lower than it was on the embedded question, but slightly higher than is was on the Fall 2011 Final Exam. Why are students doing so poorly on the Sampling Distribution concept on the Final Exam? Data Collection The Statistics C3 (Course Content Coordinator) Professors developed the embedded question and provided both the question and its correct solution to all Spring 2012 Statistics Professors. Statistics Professors were provided with a Tally Sheet to use while grading the embedded question and instructions regarding where to submit their completed Tally Sheets. Statistics Professors were also required to complete another Tally Sheet when they graded a similar question on the Final Exam at the end of the semester. 75% of the Statistics Professors participated in the embedded question intervention, and 100% participated in the Final Exam data collection. Statistics Professors see a need to improve students’ understanding of the Sampling Distribution Concept after reviewing the results of the Final Exam core question analysis. Plan During the January 2012 World Café, Statistics professors met to develop an action plan to address the information learned from the data collection and analysis that had occurred for certain Final Exam questions. Over multiple semesters the Sampling Distribution question has had a low percentage of students calculating the correct answer. Are the students just not remembering this concept at the end of the semester on a comprehensive exam, or is the concept not being fully learned or understood in the first place? To find the answer to this question, we decided to have all instructors embed the exactsamequestion on their regular Unit Exam when this concept was being tested during the course of the semester. Conclusions and Next Steps The C3 instructors are pleased with this result and believe that the poor student performance on this question on the Final Exam is due to lack of retention rather than failure at learning the concept in the first place. A Statistics Table at the World Café during August 2012 is planned where we will share these results and brainstorm ideas about what to do next. Statistics C3 Instructors: Donna Helgeson, Ron Palcic, and Bill Robinson Sampling Distribution Population Distribution µ
Keys to Closing the Loop! Or “How to Keep Moving!” • Focus on ONE Objective • Need dedicated time • Need a team • Champion/owner • Data Person • Cheerleader(s)
Try it! Track it! Share it!
Thank you • Please sign the list with your name and email address if you would like to receive more information