Download
1 / 9
120 likes | 345 Views
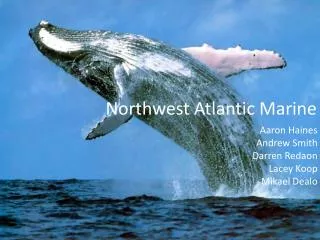
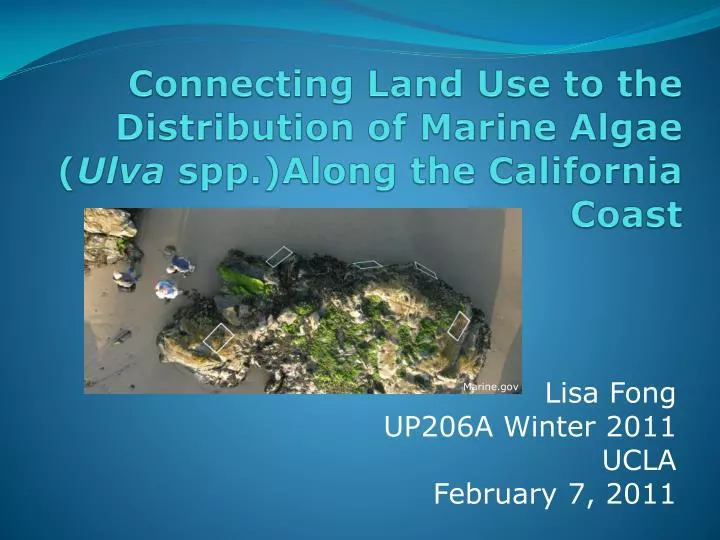
Connecting Land Use to the Distribution of Marine Algae ( Ulva spp.)Along the California Coast. Lisa Fong UP206A Winter 2011 UCLA February 7, 2011. Marine.gov. Multi-Agency Rocky Intertidal Network (MARINe) Sampling. Spring and Fall, 1981-present 5 replicate photoplots per site

E N D
Connecting Land Use to the Distribution of Marine Algae (Ulva spp.)Along the California Coast Lisa Fong UP206A Winter 2011 UCLA February 7, 2011 Marine.gov
Multi-Agency Rocky Intertidal Network (MARINe) Sampling • Spring and Fall, 1981-present • 5 replicate photoplots per site • Each plot scored into 100 squares to estimate percent cover Marine.gov Skill: Inset map Sources: MARINe Database, ESRI
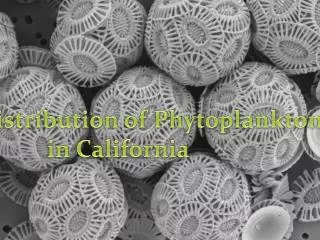
Ulva spp. (Sea Lettuce) • Cosmopolitan ephemeral algae • Early successionalspecies; indicator of recent disturbance • Lifespan 0-3 months • Algae species and populations have optimal growing temperatures (e.g. de Casabiancaet al. 2002) • Has been seen in abundance in a Southern Californian eutrophic environment (Murray and Littler 1978) pt-lobos.com www.elkhornslough.org www.ubcbotanicalgarden.org
Questions Addressed Potential Policy Applications • Can a temporal difference in Ulva distribution be seen in survey data? • What is the spatial relationship between the presence of Ulva and certain types of land use in Southern California? • Water discharge regulation • Land use permitting for agriculture or development Photo by Carlos Robles
Spring Ulva Presence: 1998 and 2003 Is there a marked difference in Ulva distribution between 1998 and 2003? • El Niño 1997-1998 • La Niña 1998-2000 Ulva Density Index Value (UDIV) = [∑(%cover)/n]/5 Skills: graph, graduated symbols Source: MARINe Database, ESRI
Impervious Land Cover and Spring 2003 Ulva Density Produced by Lisa Fong Impervious Land Cover Hydromodification due to urbanization leads to loss of ecological water quality improvement and rapid flow of untreated urban runoff to the ocean during large rain events. Skills: graduated symbols Sources: MARINe Database, ESRI, National Atlas, USGS
Southern California Vineyard and Winery Locations and Spring 2003 Ulva Density • The U.S. Environmental Protection agency (2005) found agriculture to be the leading source of impairment to surveyed rivers and lakes • Runoff flowing over agricultural land picks up sediment, nutrients (P, N, K), pathogens, salts, pesticides, metals Skills: graduated symbols, geoprocessing(merged county hydrology shapefiles), geocoding (vineyard addresses), attribute subselection (2003aboveZ[ero] was derived by Querying 2003Spring for ULV_ADJ_SP03 > 0 and exporting data to a new layer) Sources: Simply Maps, ESRI, National Atlas, MARINe Database
Southern California Vineyard and Winery Locations and Spring 2003 Ulva Density: Central Coast Watersheds Skills: inset map, graduated symbols, geoprocessing, geocoding, attribute subselection Sources: Simply Maps, ESRI, National Atlas, MARINe Database
Future Plans • Explore pattern of distribution over a continuous period of years (1996-2006) • Compare Ulva presence data to yearly rainfall amounts • Investigate spatial relationships between Ulva presence and sewage outfalls, public access locations, population densities, grazing land Photo by Colin Bates