Download
1 / 17
170 likes | 303 Views
Wind Chill: A Forward Approach . Kelly Balmes , Brian Adams, Justin McCoy . Introduction. Statement of the Problem: When cold temperatures already exist, wind can make the situation much worse.

E N D
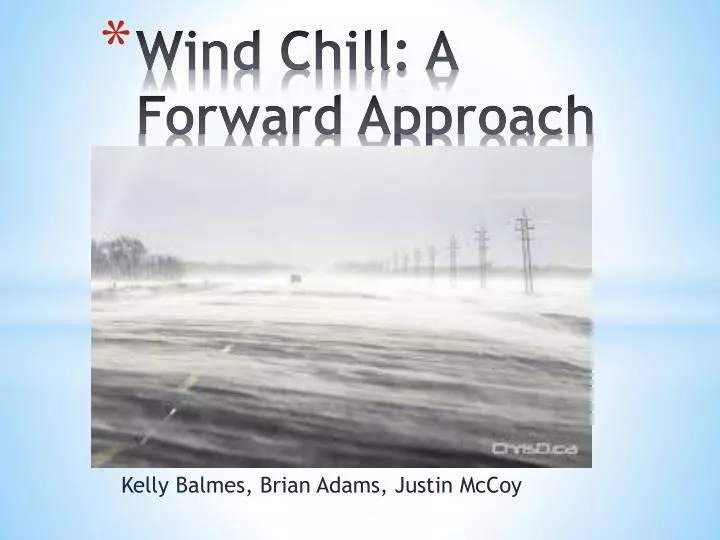
Wind Chill: A Forward Approach Kelly Balmes, Brian Adams, Justin McCoy
Introduction Statement of the Problem: When cold temperatures already exist, wind can make the situation much worse. Dangerously low wind chill temperatures can cause serious health concerns such as frostbite, hypothermia, breathing impediments for sensitive groups, and other health complications. It is for this reason that having timely forecasts is of the utmost importance for the protection of human life.
Air mass of arctic origin draped across the Northern Midwest • Wind gusts of 25 to 45 mph, wind chill values of -35 to -55 degrees • Coldest stretch of weather since February of 1996 • Wind Chill Warnings issued 48 hours in advance,all of Iowa, Minnesota, and Wisconsin were under warnings • All schools closed on Monday the 6th, most remained closed on the 7th. • Also used data from January 24th-26th, anothersignificant cold spell Case Study: January 5-7, 2014 Cold Spell
Objectives Create plots of probabilities that determine the chance of temperatures exceeding the thresholds for either an advisory or a warning for two different lead times (24 and 48 hours). Determine the likelihood of an advisory or warning being issued for the inputted latitude and longitude.
Description of Input Data Collection of SREF ensemble files – provided by Dr. Greybush. Data from January 4th, 6th, 24th, and 26th, 2014 Actual wind chill advisory and warning events.
Decision Support Algorithm Defined threshold temperatures values for wind chill advisories and warnings. Wind Chill= 35.74 + 0.6215T - 35.75(V0.16) + 0.4275T(V0.16) Advisory threshold = -26.111 degrees C Warning Threshold = -31.667 degrees C Calculated probabilities of thresholds being exceeded. Calculated how many ensemble members had exceeded the threshold at each grid point.
Implementation Details Inputted latitude and longitude read in from the terminal. Probabilities were calculated using data from all the ensemble members and thresholds. Detailed maps were created, showing which areas were experiencing conditions that were conducive to significantly low wind chill temperatures.
Description of Output Output came in the form of plotted maps, like the one shown below, for wind chill temperatures.
Description of Output The output also delivers probabilities of advisories and warnings at each grid point.
Description of Output The output also delivers probabilities of advisories and warnings at each grid point.
Description of Output The output also displays to the terminal the likeliness (over or under 50% probability) of a warning or advisory being issued for an inputted latitude and longitude, which can physically be entered by a user of the program.
Test Plan and Examples Two cities were chosen in order to test the validity of our program’s ability to determine wind chill advisories and warnings. First Test: Madison, WI (43.0667N, 89.4W) – test results yielded likely wind chill advisory and warnings.
Test Plan and Examples Second Test: Dallas, Tx (32.7758N, 96.7967W) – test results yielded unlikely wind chill advisories and warnings.
Potential Uses of this Product Can be used as a forecasting tool for forecasters determining wind chill advisory and warnings for particular locations. Forecasters will be able to input SREF data for a particular day to enhance their forecasts. Emergency management could use it for event cancellations if wind chill advisories or warnings were likely to be issued for the inputted latitude and longitude of an event venue.
Future Improvements Different categories of likeliness for advisories/warnings (i.e. slight risks, moderate risks, high risks) Filtering out temperatures not conducive to significant wind chill conditions (i.e. 80 degrees in Florida) Taking different wind chill thresholds into account for each state Specifying the forecast lead times via terminal input, instead of just having 24- and 48-hour forecasts
In Summary SREF ensemble files used to help determine wind chill advisories and warnings. Calculated probabilities of the likelihood of wind chill advisory and warnings. Program output generates maps of wind chill advisory/warning probabilities, as well as wind chill temperatures. Users of the program may input a specified latitude and longitude value. Terminal prints to the screen the likelihood of a wind chill advisory/warning for the desired location.