Download
1 / 50
500 likes | 596 Views
Collective neural dynamics and drift-diffusion models for simple decision tasks. Philip Holmes, Princeton University. Eric Brown (NYU), Rafal Bogacz (Bristol, UK), Jeff Moehlis (UCSB), Phil Eckhoff, Sophie Liu, Angela Yu and Jonathan Cohen (Princeton),

E N D
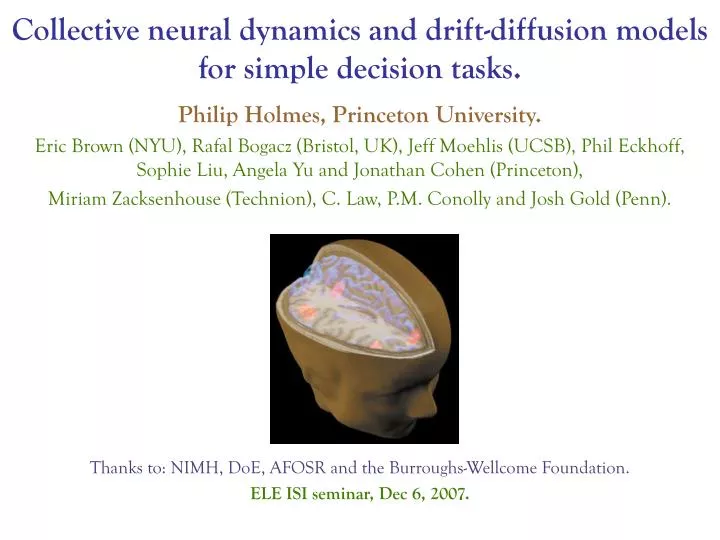
Collective neural dynamics and drift-diffusion models for simple decision tasks. Philip Holmes, Princeton University. Eric Brown (NYU), Rafal Bogacz (Bristol, UK), Jeff Moehlis (UCSB), Phil Eckhoff, Sophie Liu, Angela Yu and Jonathan Cohen (Princeton), Miriam Zacksenhouse (Technion), C. Law, P.M. Conolly and Josh Gold (Penn). Thanks to: NIMH, DoE, AFOSR and the Burroughs-Wellcome Foundation. ELE ISI seminar, Dec 6, 2007.
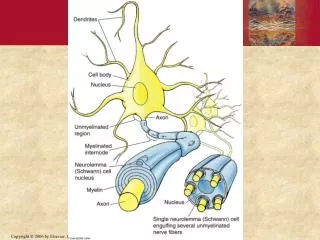
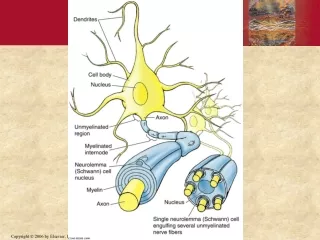
Ingredients:~1011 neurons, ~1014 synapses. Structure:layers and folds. Communication:via action potentials, spikes, bursts. The multiscale brain: Sources: www.siumed.edu/~dking2/ssb/neuron.htm#neuron, webvision.med.utah.edu/VisualCortex.html
Multiple scales in the brain and in math: Today’s talk
Contents 1: Drift-diffusion models and an optimal speed-accuracy tradeoff: behavioral tests. 2:Threshold setting, uncertainty and Information gap theory: more behavioral tests. 3:Drift-diffusion models, deadlined responses, psychometric fucntions, and learning. 4:Incorporating biases and priors: top-down vs. bottom up. Moral: You can learn a lot from a simple model
A really simple decision task: “On each trial you will be shown one of two stimuli, drawn at random. You must identify the direction (L or R) in which the majority of dots are moving.” The experimenter can vary the coherence of movement (% moving L or R) and the delay between response and next stimulus. Correct decisions are rewarded. “Your goal is to maximize rewards over many trials in a fixed period.”You must be fast, and right! 30% coherence 5% coherence Courtesy: W. Newsome Behavioral measures: reaction time distributions, error rates. More complex decisions: buy or sell? Neural economics.
1. Making the most of a stochastic process. Drift-diffusion among multiple alternatives. McMillen & H, J. Math. Psych, 2006. Underlying hypothesis: Human and animal behaviors have evolved to be (near) optimal. (Bialek et al., 1990-2005: Fly vision & steering.)
An optimal decision procedure for noisy data:the Sequential Probability Ratio Test Mathematical idealization: During the trial, we draw noisy samples from one of two distributions pL(x) or pR(x) (left or right-going dots). The SPRT works like this: set up two thresholds and keep a running tally of the ratio of likelihood ratios: When first exceeds or falls below , declare victory for R or L. Theorem: (Wald, Barnard) Among all fixed sample or sequential tests, SPRT minimizes expected number of observations n for given accuracy. [For fixed n, SPRT maximises accuracy (Neyman-Pearson lemma).] pL(x) pR(x)
The continuum limit is a DD process Take logarithms: multiplication in becomes addition. Take a continuum limit: addition becomes integration. The SPRT becomes a drift-diffusion (DD) process (a cornerstone of 20th century physics): drift rate noise strength Here is the accumulated evidence (the log likelihood ratio). When reaches either threshold , declare R or L the winner. But dohumans (or monkeys, or rats) drift and diffuse? Evidence comes from three sources: behavior, neural recordings, and mathematical models.
Behavioral evidence: RT distributions Human reaction time data in free response mode can be fitted to the first passage threshold crossing times of a DD process. Prior or bias toward one alternative can be implemented by setting starting point . Ratcliff et al., Psych Rev. 1978, 1999, 2004, … Simen et al., in review, 2007. thresh.+Z drift A thresh.-Z
Neural evidence 1: firing rates Spike rates of neurons in oculomotor areas rise during stimulus presentation, monkeys signal their choice after a threshold is crossed. thresholds J. Schall, V. Stuphorn, J. Brown, Neuron, 2002. Frontal eye field (FEF) recordings. J.I Gold, M.N. Shadlen, Neuron, 2002. Lateral interparietal area (LIP) recordings.
Neural evidence 2: spiking neuron models Working hypothesis: MT motion sensitive cells in visual cortex pass noisy signals on to LIP, FEF, … where integration occurs. LIP MT thresholds Adapted from X.-J. Wang, Neuron, 2002; K-F. Wong & X.-J. Wang, J. Neurosci., 2006. Pools of spiking neurons with synaptic connections. Ongoing work extending to model NE modulation of LIP: P. Eckhoff & K-F. Wong. Stochastic averaging over populations: A. Saxe. Adapted from K.H. Britten, M.N. Shadlen, W.T. Newsome, J.D. Schall & A. Movshon, various papers, 1993-2001.
Model evidence: integration of noisy signals thresh. 2 We can model the decision process as the integration of evidence by leaky competing accumulators (LCAs): (Usher & McClelland, 1995,2001) Subtracting the accumulated evidence yields a DD process for . thresh. 1 Stochastic center manifold Brown et al. Int. J. Bifurcation & Chaos 15, 2005. Bogacz et al. Psych. Review 113, 2006.
Reduction of a neural network to a DD/OU process bottom-up Attention top-down Model for the Eriksen task: control of attention leads to variable drift rates. Servan-Schrieber et al., 1998; Liu, H & Cohen, Neural Comp. (in press), 2007. Data fits Accuracy Accuracy Resp. time Resp. time OK, maybe. But do humans (or monkeys, or rats) optimize?
RT D RT D An optimal speed-accuracy tradeoff 1 The task: maximize rewards for a succession of free response trials in a fixed period. Reward Rate: response-to-stimulus interval (% correct/average time between resps.) • Threshold too low • Too high • Optimal $ $ X X X D RT D RT RT D RT D RT D $ $ RT D RT D RT $ $ $ X D D D RT RT RT RT
An optimal speed-accuracy tradeoff 2 How fast to be? How careful? The DDM delivers an explicit solution to the speed-accuracy tradeoff in terms of just 3 parameters: normalized threshold and signal-to-noise ratio and D. So, setting the threshold we can express RT in terms of ER and calculate a unique, parameter-free Optimal Performance Curve: RT/D = F(ER)
Behavioral test 1: most are not optimal Do people adopt the optimal strategy? Some do; some don’t. Is this because they are optimizing a different function? e.g. weighting accuracy more? Or are they trying, but unable to adjust their thresholds? OPC Bottom line:Too much accuracy is bad for your bottom line.(Princeton undergrads don’t like to make mistakes.)
Behavioral test 2: a premium on accuracy? A modified reward rate function with a penalty for errors gives a family of OPCs with a free parameter: the weight placed on accuracy. It fits the data as a whole better, but what’s explained? accuracy weight increasing data fit OPC Short version: Holmes et al., IEICE Trans. E88A, 2005. Long version: Bogacz et al. Psych. Review 113, 2006.
2. Choosing thresholds Q: Suboptimal behavior could be reckless (threshold too low) or cautious (threshold too high)? Why do most people tend to be cautious? Could it be a rational choice? Which type of behavior leads to smaller losses? A:Examine the RR function. Slope on high threshold side is smaller than slope on low threshold side, so for equal magnitudes, conservative errors cost less. (Simple answer, can learn more from info gap theory.) threshold too high: small reward loss threshold too low: larger reward loss. threshold
Thresholds and gain changes So, how might thresholds be adjusted ‘on the fly’ when task conditions change? Neurons act like amplifiers, transforming input spikes to output spike rates. Gain improves discrimination, reduces noise. Servan-Schreiber et al., Science, 1990. gain output (spike rate) threshold input Neurotransmitter release can increase gain. Specifically, norepinephrine can assist processing and speed response in decision tasks
Locus coeruleus offers a mechanism for gain changes The LC, a neuromodulatory nucleus in the brainstem, releases norepinephrine (NE) widely in the cortex, tuning performance. The LC has only ~30,000 neurons, but they each make ~250,000 synapses. Transient bursts of spikes triggered by salient stimuli cause gain changes, thus bigger response to same stimulus. Devilbiss and Waterhouse, Synapse, 2000. Aston-Jones & Cohen, Ann. Rev. Neurosci., 2005. Usher et al, Science, 1999; Brown et al. J Comp. Neurosci. 2004. same stimulus
A model for block-by-block threshold adjustment An algorithm based on reward rate estimates and a linear reward rate rule can make rapid threshold updates iteratively. Simen, Cohen H, Neural Networks 19, 2006. But: Can RR be estimated sufficiently accurately? Requires good interval timing. Can the rule be learned (RL)? Does noise cause overestimates? A complicated story, which leads us to consider the role of uncertainty. Threshold
Info gap allows for uncertainties in parameter estimates, and can be applied to DD process models of forced choice tasks. E.g., suppose that response-to-stimulus interval is only known within bounds around an estimate . uncertainty There are two approaches: Min-max:Choose the threshold that maximizesRRfor given uncertainty . Robust satisfy:Maximize uncertainty for which a given (and necessarily suboptimal)RRcan be guaranteed. Similar treatment for uncertainties in SNR . The information gap approach Y. Ben-Haim. Information Gap Decision Theory: Decisions under severe uncertainty. Academic Press, New York, 2006.
when treated via the min-max strategy appear to match the overall data best: Uncertain RSIs: RSPCs. Uncertain RSIs: min-max. Performance bands & higher thresholds for poorer timers. Uncertain SNRs: min-max. Uncertainties in response-to-stimulus interval
Split the data into three subgroups by overall winnings The picture becomes much clearer. The top 30% group perform near-optimally; data from the next 60% and bottom 10% are much better fit by the min-max strategy, with uncertainty in RSI. Weighted accuracy is the runner up. Note: 1 parameter to fit for all curves except OPC (parameter free). OPC M. Zacksenhouse, PH & R. Bogacz (in review., 2007). Conjecture: conservatives are poor interval timers. [A. Saxe is running behavioral experiments to text this.]
3. Fixed viewing time (deadlined) tests can also be modeled by DD processes. One considers the PDF of sample paths of the SDE, which is governed by the forward Fokker-Planck or Kolmogorov PDE: General solutions for time-varying drift (SNR) are available, so …
… we can predict psychometric functions (PMFs): Accuracy for fixed viewing timeT: DD model with variable drift, e.g.: scale coher. expt. asmpt. decay rate DD model fitted to data from monkeys doing moving dots task during training.
DD parameter changes can characterize learning Scale factor : steady increase in SNR. MT to LIP synapses strengthen. Coherence exponent Decay rate : irregular oscillns. rescaling sensors? ????? P. Eckhoff, PH, P. Conolly, C. Law & J.I. Gold, New J Phys., in press, 2007).
4. DD can incorporate bias and expectations as well as sensory evidence(work in progress) A motion discrimination task with multiple reward conditions • Given rewardbias, subject must discriminate motion direction. • Variable coherences span psychophysical threshold, creating a range of difficulty. • Creates conflict between sensory and reward information: bottom-up and top-down influences. • Only correct choices are rewarded. Subject informed of reward bias before stimulus appears. Thanks to: A. Rorie & W.T. Newsome (in prep., 2007).
Relative reward magnitudes modulate behavior Absolute magnitude no effect on choice T1 T1 T1 T1 Relative magnitude biases choices T2 T2 T2 T2 n=51 T1 T2
Neural data: Representation of relative reward magnitude in LIP n=51 Chose left (T2) Chose right (T1) Rorie &Newsome (in prep., 2007). The DD model can integrate bottom-up and top-down inputs, may help elucidate this more complex decision process.
Psychometric functions predicted by DD/OU models Using the DD or OU process with interrogation protocol and a model for reward expectation bias, we can compute PMFs: stable OU DD unstable OU
DD/OU models with reward bias priors, 1 Simple models for reward expectation bias modify PMFs, e.g.: reward cue period motion period This produces a shifted PMF (previous slide). We can also calculate optimalbiases that maximize rewards, and compare with animal performance: … calculate, calculate, … reward ratio 1/SNR S. Feng & H, work in progress, 2007.
DD/OU models with reward bias priors, 2 Optimal biases depend logarithmically on reward ratio (bias on initial condition shown here): increasing coherence increasing coherence We will fit such models to the Rorie-Newsome data.
Summary • Neural activity in simple decisions resembles a DD process: the model predicts optimal speed-accuracy tradeoffs. • Information gap theory allows for uncertainty in parameter estimates:robust suboptimal performance. • Fast threshold adjustments can optimize rewards in free response mode: relies on interval timing ability. • The DD process can model cued responses, predict psychometric functions for fixed viewing times: variable SNR and drift rates can track slow learning. • DD processes extend to include top-down cognitive control. Good mathematical models are not just (reasonably)faithful; they’re also simple and (approximately)soluble. They focus, sharpen questions, and simplify. Thanks for your attention!
Additional material • DDM approximates Bayesian updating • Incorporating biased stimuli via initial conditions • Incorporating sequence effects via initial conditions • Some details on information gap theory
Bayesian updating can also be reduced to DD processes Eriksen task, 2AFC with conflict: Respond to center stimulus compatible: SSS, HHH incompatible: HSH, SHS S. Liu, A. Yu & PH (in review, 2007).
Prior expectations can be incorporated into DD models by biasing the initial conditions. For example, in case of biased stimuli S1 with probability and S2 with probability , we set: Unbiased DD: Biased DD: Biasing choices via initial conditions 1 Biased rewards can be treated similarly, with dependence on D also. For free response protocol. Simen et al., in review, 2007.
More frequent stimuli (S1 > S2) or biased rewards also affect optimal thresholds, and initial conditions and thresholds can collide, predicting instant responding. Biased stimuli Biased rewards Biasing choices via initial conditions 2 Thresholds Initial conds Always choose more probable alternative if above critical surface. SNR RSI Simen et al., in review, 2007.
DD dynamics during successive blocks of trials with different stimulus probabilities and RSIs:
Behavioral data: biased stimuli RSIs 0.5 s 1.0 s 2.0 s Prob resp. RTs ERs Simen et al., in review, 2007.
Including sequence effects in 2AFC modelsLCA inherits initial conditions from prior sequence: Post response Symm bias due to Asymm bias due to relaxation in RSI conflict (ACC) expectation (PFC) Automatic Facilitation & Subjective Expectancy? Or just different time constants of internal & top-down dynamics? Gao et al., in prep., 2007.
Model and behavioral data: RSI effects Gao et al., in prep., 2007.
Uncertainties in delays: min-max approach We work with inverse RR: Assume SNR is known. The min-max thresholds optimize the worst possible performance (i.e. the max of IR): Internal maximization is achieved at with threshold It’s just a scaled version of the OPC!
Uncertainties in delays: robust satisfying approach Robustness is max uncertainty for given desired performance: It differs from the OPC, even if .
Robustness and opportuneness (!) curves Opportunity describes ‘windfall performance’ that can occur under unusually favorable conditions (e.g. RSI is shorter than you think: ).
Details: parameter fits and likelihood ratios: L to R: Performance bands grow (greater uncertainty); desired performance degrades, and accuracy weights increase. similar fit quality Runners up: RSPC for D OPC for RA
Conte Meeting Nov 12, 2007More DDancing about (OUch!)Project 6 DD/OU models can incorporate bias and expectations as well as sensory evidence. Initial conditions and/or drift rates can reflect prior expectations regarding stimuli or rewards, or other top-down controls: And nonlinear terms may be essential to capture attractor dynamics (KF Wong, …): NOT TODAY