Download
1 / 47
490 likes | 655 Views
Overview - I. OFDMA has link level advantage over LFDMA equalization loss for moderate to high C/I up to 2dB L-FDMA has PAPR advantage over OFDMA ranging from ~1.5dB for 16QAM to ~2.5dB for QPSK PAPR advantage offset by multiplexing multiple waveform

E N D
Overview - I • OFDMA has link level advantage over LFDMA • equalization loss for moderate to high C/I up to 2dB • L-FDMA has PAPR advantage over OFDMA • ranging from ~1.5dB for 16QAM to ~2.5dB for QPSK • PAPR advantage offset by multiplexing multiple waveform • PAPR advantage of LFDMA is often interpreted as power efficiency advantage • “LFDMA can use a smaller backoff and transmit a higher average power that for the same power amplifier (PA) size” • “hence PAPR advantage = C/I advantage”
Overview - II • We analyze performance loss of OFDMA versus LFDMA when both systems operate at the same backoff value and PA model • spectral mask margin: measured as proximity to the allowed limit of out-of-band emission level • self distortion: SINR loss seen by the user due to self-interference caused by non-linear distortion • in-band distortion: average SINR loss seen by other users from a user that experiences non-linear distortion • our analysis assumes 5MHz spectrum allocation • We introduce and analyze a simple mitigation technique that reduces the effect of non-linear distortion on spectral mask margin • mitigation through a simple scheduling rule: no added complexity • based on the suggested MBWA design • helps all multiple access schemes, including OFDMA and LFDMA
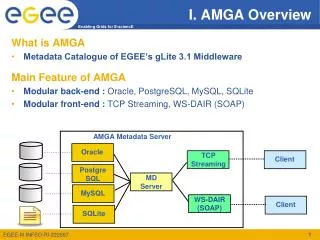
base nodes frequency subband #2 subband #n subband #1 hops sets of 16 contiguous tones Mitigation of mask margin reduction - I • Out-of-band emission level depends not only on PAPR, but also on the total bandwidth spanned by the assignment and proximity of this span to the edge of spectrum allocation • smaller assignment span lower out-of-band emission level • further away from the edge lower out-of-band emission level • MBWA features subband hopping • channels within a sub-tree of 128 tones (8 channels) hop locally within a subband • gain through subband scheduling: based on user channel fading • interference diversity through hopping within a subband
Mitigation of mask margin reduction - II • Schedule power limited users predominantly on the inner subbands: away from the edge of spectrum allocation • high QoS users with limited PA size at sector/cell edge • best effort users at sector/cell edge that are not constrained by interference control (user’s TX power limited by a busy bit from adjacent sectors) • Schedule users without power limitation on the remaining spectrum: • best effort users at sector/cell edge that are constrained by interference control (user’s TX power not limited by a busy bit from adjacent sectors) • users with large enough PA size • users with high C/I: these users marginally benefitfrom a further increase in C/I • Subband selection: scheduler takes into account user’s power limitation as well as channel selectivity across subbands • AT adjusts its PA backoff according to its assignment location
Power amplifier model • We assume a popular Solid State Power Amplifier (SSPA) model commonly known as Rapp model • amplitude distortion given by the following equation • In this study we assume • No phase distortion according to Rapp model • Input PA backoff is w.r.t. 1dB compression point: • Output PA backoff w.r.t. 1dB compression point PA input voltage PA output voltage Rapp model parameter typical: P = 2 -- 3 PA saturation level
Spectrum mask margin • Out of band emission level is measured according to FCC mask requirements for MMDS band meets three conditions: • total transmit power integrated over any contiguous region of 1% of bandwidth allocation within 1MHz adjacent to the channel allocation should not exceed -13dBm • total transmit power integrated over 1MHz which is 1MHz away from the edge of the channel allocation should not exceed -13dBm • total transmit power integrated over 1MHz which is 5.5MHz away from the edge of the channel allocation should not exceed -25dBm • Definition of the mask margin • difference between the allowed and the actual emission level • select the worst case margin out of the three conditions PSD at PA output Measurement bandwidth Mask limit Total TX power: 23dBm
Mask margin versus PA backoff User assignment in the edge subband, 16 tones
Mask margin versus PA backoff Note that such a difference between OFDMA and LFDMA in out-of-band emission level is due to scattered OFDMA assignment versus localized LFDMA assignment for assignment sizes >16 tones rather than PAPR difference User assignment in the edge subband, 32 tones
Mask margin versus PA backoff User assignment in the edge subband, 112 tones
Mask margin versus PA backoff User assignment in the middle subband, 16 tones
Mask margin versus PA backoff Note that a drastic difference between OFDMA and LFDMA in out-of-band emission level is due to scattered OFDMA assignment versus localized LFDMA assignment for assignment sizes >16 tones rather than PAPR difference User assignment in the middle subband, 32 tones
Mask margin versus PA backoff User assignment in the middle subband, 128 tones
Conclusions • Users scheduled in an edge subband • for medium and large assignments, OFDMA needs about 2 dB additional PA backoff than LFDMA, in order to maintain similar margin to the spectral mask • however, for small assignments, both OFDMA and LFDMA can operate with similar PA backoffs, while maintaining adequate margin to the spectral mask • Users scheduled in a middle (interior) subband • both OFDMA and LFDMA can operate at similar (low) PA backoffs, while maintaining (more than) adequate margin to the spectral mask • By scheduling users in a middle subband, both OFDMA and LFDMA maintain sufficient mask margin even at 0dB backoff • both OFDMA and LFDMA can operate at 0dB backoff • PAPR disadvantage of OFDMA does not affect its power efficiency relative to LFDMA as far as spectrum mask is concerned, when users are scheduled away from the edge of spectrum allocation
PA distortion model Receiver Self distortion • Defined as degradation in C/I of a user caused by non-linear distortion of its waveform by PA • SINR loss through self distortion • Signal to distortion ratio distortion power unit power input
Signal to distortion ratio versus PA backoff User assignment in the middle subband, 16 tones
Signal to distortion ratio versus PA backoff User assignment in the middle subband, 128 tones
Self distortion SINR loss versus C/I User assignment in the middle subband, 16 tones, 0dB output backoff
Self distortion SINR loss versus C/I User assignment in the middle subband, 16 tones, 2dB output backoff
Self distortion SINR loss versus C/I User assignment in the middle subband, 16 tones, 4dB output backoff
Self distortion SINR loss versus C/I User assignment in the middle subband, 16 tones, 6dB output backoff
Self distortion SINR loss versus C/I User assignment in the middle subband, 128 tones, 0dB output backoff
Self distortion SINR loss versus C/I User assignment in the middle subband, 128 tones, 2dB output backoff
Self distortion SINR loss versus C/I User assignment in the middle subband, 128 tones, 4dB output backoff
Self distortion SINR loss versus C/I User assignment in the middle subband, 128 tones, 6dB output backoff
Conclusions • Both OFDMA and LFDMA incur fairly small SINR loss even at low backoff values • OFDMA with 2dB output backoff: less than 0.2dB @ C/I = 0dB, less than 1.2dB @ C/I = 13dB • L-FDMA with 2dB output backoff: less than 0.1dB @ C/I = 0dB, less than 0.4dB @ C/I = 13dB • SINR loss at high C/I has limited effect for user throughout • The advantage of LFDMA at high C/I within 1dB is offset by equalization loss of about 1-2dB in this C/I region for relatively large assignments
PA distortion model Receiver In-band distortion • Defined as degradation in C/I to other users within subband due to increased interference level cased by PA distortion of a given user • Note that depends on PA model & backoff, assignment size & location, modulation order & multiple access scheme • SINR loss through in-band distortion average in-band distortion power average transmit power Total RX interference PSD average received in-band distortion PSD Receive C/I of the distorted user = ratio of user assignment to the remaining bandwidth within subband
In-band distortion SINR loss versus C/I User assignment in the middle subband, 122 tones, 0dB output backoff
In-band distortion SINR loss versus C/I User assignment in the middle subband, 122 tones, 2dB output backoff
In-band distortion SINR loss versus C/I User assignment in the middle subband, 122 tones, 4dB output backoff
In-band distortion SINR loss versus C/I User assignment in the middle subband, 122 tones, 6dB output backoff
Conclusions • Both OFDMA and LFDMA have fairly small SINR loss even at low backoff values • OFDMA with 2dB backoff: less than 0.2dB @ C/I = 0dB, less than 0.9dB @ C/I 13dB • LFDMA with 2dB backoff: less than 0.1dB @ C/I = 0dB, less than 0.4dB @ C/I 13dB • The difference between OFDMA and LFDMA w.r.t. in-band distortion SINR loss is within 0.5dB for the C/I range of interest • this is the worst case scenario in terms of in-band distortion. since the assignment size was assumed to be large
Observations - I • LFDMA has advantage over OFDMA in terms of spectrum mask margin when power limited users with relatively small size assignments get resources close to the edge of spectrum allocation • Both OFDMA and LFDMA benefit from scheduling power limited users in a middle subband in terms of spectrum mask margin • Both OFDMA and LFDMA have an adequate spectrum mask margin when user is scheduled in a middle subband at a very low backoff values • output backoff of 0dB w.r.t. 1dB PA compression point • LFDMA has ~1dB advantage in self-distortion SINR at high C/I • this advantage is offset by LFDMA equalization loss (1-2dB) for relatively large assignments at high C/I
Observations - II • The advantage of LFDMA in terms of in-band distortion SINR loss is small (within 0.5dB) in the C/I region of interest • worst case (pessimistic) scenario • LFDMA suffers equalization loss for large assignments at medium to high C/I • At low C/I and relatively small assignment sizes LFDMA PAPR advantage is offset by multiplexing traffic with control • alternatively time division multiplexing of traffic and control results in a permanent link budget hit for either or both of them because of a reduced duty cycle • To maintain PAPR advantage, LFDMA pilot design is limited to a narrow family of signals that have low PAPR and flat p.s.d. • the number of such signals is limited (essentially GCL sequences) • different sequences should be used in different sectors and/or by different overlapping users of the same sector (RL SDMA) • the use of low PAPR pilot sequences requires careful cell planning
Assumptions (I) • Eight cases: • 21 dBm Max Output Power(equivalent to 28 dBm PA with 7 dB static backoff) • 23 dBm Max Output Power (equivalent to 28 dBm PA with 5 dB static backoff) • 28 dBm PA (Output power at 1 dB compression point), with dynamic backoff for OFDMA and LFDMA • Minimum backoff 5 dB • 26 dBm PA with dynamic backoff for OFDMA and LFDMA • Minimum backoff 3 dB • 23 dBm PA with dynamic backoff for OFDMA and LFDMA • Minimum backoff 0 dB • Dynamic backoff adjusts PA backoff based on assignment size and location, so as to maintain an acceptable margin to spectral mask
Assumptions (II) • With dynamic PA backoff, max transmit power at the AT is modeled as a function of assignment size and location (interior vs. edge subband) • Impact of all associated distortions are modeled in the system sim • self-distortion & in-band distortion • Scheduler assigns each user to a subband that provides the largest assignment with the user’s max power constraint for that subband • Equalization and diversity losses for LFDMA are not modeled • Simulation assumptions: • Evaluation methodology in the following slides • PedB 3 km/h • 4 and 10 users per sector
System is power limited Transmit PSD is determined by delta-based power control Transmit bandwidth is limited by maximum PA size 21 dBm max output power results in 49% bandwidth usage 23 dBm max output power results in 55% bandwidth usage Dynamic PA backoff results in 54-55% bandwidth usage for both OFDMA and LFDMA (essentially the same as 23 dBm max output power) 4 Users/Sector, System Loading
21 dBm max output power is shown to have 10% loss in sector throughput compared to 23 dBm max output power Dynamic PA backoff (with 26 dBm PA or 28 dBm PA) achieves almost identical performance as fixed, 23 dBm max output power Same sector throughput Same mobile throughput fairness With 23 dBm PA, dynamic PA backoff yields a difference of less than 5% between LFDMA and OFDMA throughput 4 Users/Sector, User Throughput
Proportional fairness scheduler tries to equalize the bandwidth resources allocated to each user. Edge users are allocated subcarriers over all interlaces. Maximum allocation size is subjected to PA constraints. On X-axis: subcarriers allocated for each user is normalized by the average number of subcarriers per user. 21 dBm max output power results in fewer subcarriers allocated to the edge users. Dynamic PA backoff (with a 23 dBm PA) results in similar fairness as 23 dBm max output power. 4 Users/Sector, Resource Allocation
Edge users are often allocated the minimum channel size due to PA constraints Decoding C/I of edge users reflects the available PA output power Dynamic PA backoff provides 0.5 to 1 dB C/I gain over 21 dBm 4 Users/Sector, Decode C/I
System is not power limited; hence PA limitation does not impact the total sector throughput. Geometric mean throughput: 21dBm Max Output Power: 2475 Kbps 23dBm Max Output Power: 2790 Kbps 28dBm PA,OFDMA dynamic backoff: 2818 kbps 28dBm PA, LFDMA dynamic backoff: 2832 kbps 26dBm PA, OFDMA dynamic backoff: 2784 kbps 26dBm PA, LFDMA dynamic backoff: 2807 Kbps 23dBm PA, OFDMA dynamic backoff: 2493 Kbps 23dBm PA, LFDMA dynamic backoff: 2634 Kbps Improved geometric mean throughput shows fairness gain of 23dBm output power over 21dBm output power Dynamic PA backoff with 26 and 28 dBm PA (1dB comp. point) achieves almost identical performance as fixed 23 dBm output power With 23 dBm PA (1dB comp. point) and dynamic PA backoff, the difference in the LFDMA and OFDMA throughput is only 5% 10 Users/Sector, User Throughput
Conclusions • With PA sizes of 28 dBm and 26 dBm (at 1 dB compression point), OFDMA and LFDMA with their corresponding dynamic PA backoff values achieve a performance almost identical to the fixed, 23 dBm max output power(28 dBm PA with 5 dB fixed backoff) • Same sector throughput • Same fairness among users • With PA size of 23 dBm and dynamic PA backoff with a minimum backoff value of 0 dB, the difference in the LFDMA and OFDMA throughputs is at most 5% • OFDMA reverse link provides link performance gains at high SNR (not included in the above analysis) • OFDMA reverse link provides much better design flexibility • Different types of waveforms (pilot tones, control channel segments etc) may be frequency-multiplexed, without incurring additional PAPR penalties • Can be exploited to improve handoff performance, control-channel link budget etc