Download
1 / 20
200 likes | 314 Views
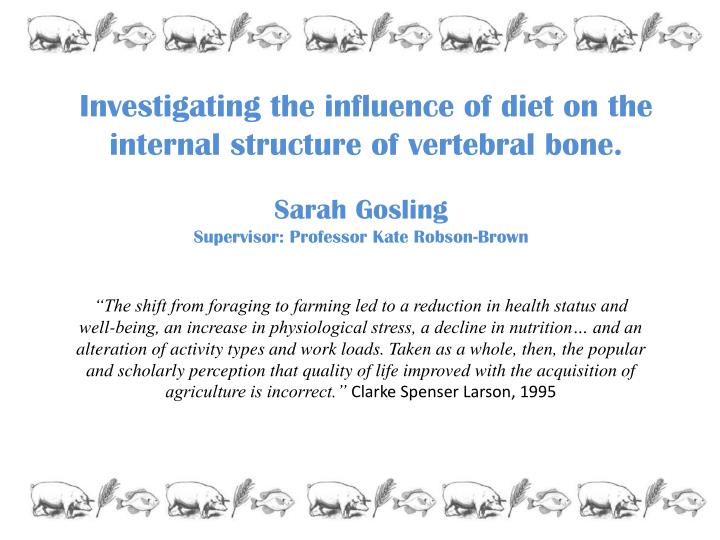
Investigating the influence of diet on the internal structure of vertebral bone. Sarah Gosling Supervisor: Professor Kate Robson-Brown.

E N D
Investigating the influence of diet on the internal structure of vertebral bone. Sarah Gosling Supervisor:Professor Kate Robson-Brown “The shift from foraging to farming led to a reduction in health status and well-being, an increase in physiological stress, a decline in nutrition… and an alteration of activity types and work loads. Taken as a whole, then, the popular and scholarly perception that quality of life improved with the acquisition of agriculture is incorrect.” Clarke Spenser Larson, 1995
Background Research The onset of agriculture: implications to skeletal health • The shift in diet and activity patterns from a hunter-gatherer lifestyle to a an agricultural lifestyle had some negative health effects (Larson, 1995 and others): • Growth retardation of developing bone • A shortening of height in adulthood • Lower bone masses • Higher levels of infections disease • Lower life expectancy • A population ‘explosion’
Background Research 2 • Some believe that bony changes occurred because of the change in activity patterns with the onset of agriculture; eg. Ruff et al. 1984, Bridges et al 1989, 1999 • More recently, evidence suggests that diet might also have played a part; eg. Katzenberg & Saunders 2011 Sharp shift in diet at the onset of the Neolithic More ‘dramatic’ in some areas than others…. but a shift in diet is almost always evident. Lifeways project and other large scale isotopic studies provide important information about changes in diets. Richards MP, Schulting RJ, Hedges, REM. Nature 2003
Questions arising… Could a change in diet lead to differences in the internal structure of bone? Vs Pig, Terrestrial diet Pig, Marine diet Aim: to determine the effect of a marine versus terrestrial diet on the development and internal structure of bone using microCT methods Note: The pigs are controlled for activity patterns (but not weight)
Questions arising 2. To what extent can changes in bone observed in human vertebrae from across the mesolithic-neolithic transition period be attributed to a dramatic shift in diet? Eg. Human, Ertbølle Culture Marine diet, Mesolithic Eg . Human, Funnelbeaker Culture Terrestrial diet, Neolithic Vs Aim: to determine if the changes observed in pig vertebrae can also be seen in human samples dated to either side of the Mesolithic/Neolithic transition period, and thus suggest the extent to which dietary shifts have affected bone health.
Progress so far… • The spines have been macerated by boiling, cleaned and dried • The height and length of each L3 vertebral body has been measured • Each L3 vertebra has been scanned by µCT at a resolution of 35µm • Each 35µm scan has been reconstructed and analysed • A small subsample (n=5) of L3 vertebral bodies have been scanned at a resolution of 10µm • A small subsample (n=5) have undergone lipid extractions to attempt to understand the n-3:n-6 PUFA ratios present in the bone
Initial results: Vertebral Length and Height Length (cm) Length Height Height (cm) 1 = 0% fish 2 = 12.5% fish 3 = 25% fish 4 = 50% fish 5 = 100% fish
What is a healthy bone? Although many studies focus on the loss or gain of bone with age or disease,… “it is becoming increasingly realised that bone quality needs to be addressed in palaepathological studies of bone loss and fragility” Agarwal 2008 Trabecular bone within facets from neural arches bearing low (left) and high (right)compressive loads Bone quality focuses on: A change in bone volume A change in connectivity between trabeculae (spacing) A change in trabecular number A change in thickness of trabecular struts A reorientation of trabecular struts in a particular direction
Initial results: µCT scans at 35µM resolution 1 = 0% fish 2 = 12.5% fish 3 = 25% fish 4 = 50% fish 5 = 100% fish BV/TV (%) Percentage Bone Volume
Initial results: µCT scans at 35µM resolution 1 = 0% fish 2 = 12.5% fish 3 = 25% fish 4 = 50% fish 5 = 100% fish Percentage Bone Volume Trabecular Spacing Tb.Sp (µm)
Initial results: µCT scans at 35µM resolution 1 = 0% fish 2 = 12.5% fish 3 = 25% fish 4 = 50% fish 5 = 100% fish Trabecular Spacing Percentage Bone Volume Trabecular Thickness Tb.Th (µm)
Initial results: µCT scans at 35µM resolution 1 = 0% fish 2 = 12.5% fish 3 = 25% fish 4 = 50% fish 5 = 100% fish Trabecular Thickness Trabecular Spacing Percentage Bone Volume Tb.N (µm^-1) Trabecular Number
Initial results: µCT scans at 35µM resolution Trabecular Number Trabecular Thickness Percentage Bone Volume Trabecular Spacing Degree of Anisotrophy 1 = 0% fish 2 = 12.5% fish 3 = 25% fish 4 = 50% fish 5 = 100% fish
Initial results: In Summary… Trabecular Number Trabecular Thickness Percentage Bone Volume Trabecular Spacing • Increasing the proportion of fish in the diet leads to… • Increased bone volume • Smaller spaces between trabeculae • Thinner trabeculae (?) • More trabeculae • Better bone health? • Up to 50% fish… 100% fish diets may be too extreme to allow healthy bone to develop. Degree of Anisotrophy 1 = 0% fish 2 = 12.5% fish 3 = 25% fish 4 = 50% fish 5 = 100% fish
Initial results: Lipid Analysis Method: Acid extraction of Polyunsaturated Fatty Acids (PUFA’s) Total lipid extract obtained from selected vertebrae (1 from each diet) FAMES (fatty acid methyl esters) separated FAMES analysed by GC-MS (gas chromatography- mass spectometry) AIMS: To determine the n-3:n-6 ratios present within the bone at death, and use this as a ‘crib sheet’ for recording dietary variance in the pigs, and in future human specimens.
Initial results: Lipid Analysis- none to report YET C18:2 (n-6) 0% Fish FAMES Fraction 100% Fish C18:2 (n-6) 13
Alpha Linoleic Acid (ALA) 18C Initial results: Lipid Analysis n-3 Family n-6 Family Linoleic Acid (LA) 18C 18C PUFA Gamma-Linoleic Acid (GLA) 18C 20C PUFA 3-Series Prostaglandins Thromboxanes 1-Series Prostaglandins COX COX Dihomogammalinolenic Acid (DGLA) 20C Eicosapentanoic Acid (EPA) 20C LOX E-series Resolvins Leukotriene B5 2-Series Prostaglandins, Thromboxanes, Lipoxins ROS COX Isoprostanes Arachidonic Acid (AA) 20C LOX Docosapentaenoic Acid (DPA) 22C Leukotriens Tri-hydroxy Derivatives Cyt-like activity ROS Adrenic Acid 22C Isoprostanes Docosahexaenoic Acid (DHA) 22C COX + Aspirin 13R-HDHA 17R-HDHA 22C PUFA LOX D-series Resolvin (Neuo)protectin Other S-enantiomer Di-hydroxy Dervivatives
Future work on the pigs In the Archaeology Lab… Scan more vertebrae at 10µm and analyse Scan vertebrae from the thoracic region? In the Chemistry Lab… Extract and analyse lipids from the original feeds In the Anatomy Lab (Leeds)… Test vertebrae for compressive strength vs diet using an FEA computer model
Acknowledgements In the Archaeology Lab… Kate Robson-Brown In the Chemistry Lab… Marisol Correa Ascencio Richard Evershed In the Anatomy Lab… Advanced thanks to Mike Adams and Trish Dolan, who offered their services over a pint, and didn’t know how serious I was - UPDATE: this work may now be done using an FEA model in Leeds My Funding body… SCAST- the Schools Competition Act Settlement Trust