Download
1 / 25
270 likes | 620 Views
Adrenal CT. Pooneh Dehghan , MD Assistant Professor of Radiology Taleghani Hospital, SBMU. Adrenal CT. Morphology and anatomy in CT Lesion characterisation. Location & Boundaries. Schematic presentation of the adrenal in CT. Shape.

E N D
Adrenal CT PoonehDehghan, MD Assistant Professor of Radiology Taleghani Hospital, SBMU
Adrenal CT • Morphology and anatomy in CT • Lesion characterisation
Shape • The shape of the gland is determined on the section where the gland was best seen. • In most cases the right gland appeared linear or slightly curvilinear. • The left gland had more of a V on a Y shape, but occasionally appeared more squat or triangular
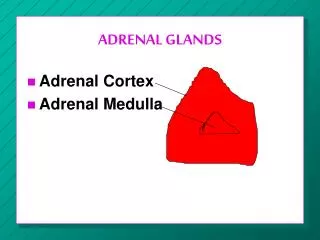
Dimensions of the gland • Adrenal glands can be divided into a body, medial and lateral limbs. • Confusion in measurements due to inconsistent shape • Generally the measurements include: Length, Width and Thickness. • Thickness was the most consistent measurement and is universally accepted as the most reliable.
Thickness of the adrenal gland • Its dimension perpendicular to the long axis of the gland or one of its limbs. • In the linear glands this tended to occur at the anterior portion, while in the V- and Y-shaped glands the site was usually at the junction of the limbs. • Thickness was not measured in triangular-shaped glands because a long axis could not be defined
The greatest thickness at any site was the measurement recorded.
. Gland and limb thickness • Most of the left glands were 1 .0 cm thick, whereas most of the right glands were less than1 .0 cm. • The maximum normal adrenal limb thickness is 5 mm
Dimensions of the glands • The normal adrenal gland was usually seen on two on three consecutive cross sections, corresponding to an approximate length of 2-4 cm. • The width of each gland was determined on the section in which the adrenal appeared largest during the examination. • About 75% of the right adrenal glands and 80% of the left glands had a maximal width of 2.0-2.5 cm.
Lesion Characterization on CT Findings that suggest a higher likelihood of malignancy • Large lesion size, • Irregular contour • Heterogeneous appearance • Pattern of enhancement • Temporal increase in size.
Size • Lesions greater than 4 cm in diameter have a higher likelihood to be either metastases or primary adrenal carcinomas • Using 3.0 cm as the maximum size cut-off, the sensitivity and specificity for adenomas was only 79 and 84%, respectively
Shape and growth pattern • Although it has been suggested that adenomas have a smooth contour, whilst malignant lesions have an irregular shape, this as a single feature is insufficient in discriminating • Rapid change in size does raise the suspicion of malignancy as adenomas are slow-growing lesions.
Intracellular Lipid Content of the Adrenal Mass • The majority (>70%) of adenomas have a high intracellular lipid content. • If an adrenal mass measures 0 HU or less, the specificity of the mass being a benign lipid-rich adenoma is 100% but the sensitivity is only an unacceptable 47%. • By using a threshold of 10 HU, the sensitivity and specificity for the detection of an adenoma at unenhanced CT is 89% and 100%, respectively.
Unenhanced CT of the adrenal glands demonstrating a left-sided adenoma. • The non-contrast-enhanced CT attenuation value of the mass is –13 HU, consistent with a lipid-rich adenoma. If the adenoma demonstrates no biochemical function, no further imaging or follow-up would be necessary.
Contrast enhancement • The normal adrenal demonstrates uniform contrast enhancement on arterial and venous phase CT and the cortex cannot be distinguished from the medulla
Contrast Enhancement and Contrast Washout Characteristics • On unenhanced CT, up to 12–30% of benign adenomas have an attenuation value of greater than 10 HU and are considered lipid poor. • Malignant lesions and phaeochromocytomas are also lipid poor. • Adenomas enhance rapidly after contrast medium administration and also demonstrate a rapid washout of contrast medium. • Malignant lesions and phaeochromocytomasenhance rapidly but demonstrate a slower washout of contrast medium.
The difference in contrast enhancement washout characteristics between adenomas and malignant lesions has been shown to be a consistent and reliable technique. • The percentage of contrast enhancement washout between enhanced images acquired 60 s after contrast medium administration and the delayed images acquired 15 min after contrast medium administration can be used to differentiate adenomas from malignant lesions
Word of caution: • These contrast medium enhancement washout values are only applicable to relatively homogeneous masses without large areas of necrosis or haemorrhage.
% ACEW (Absolute Contrast Enhancement Washout) • If a 15-min delayed protocol is used, an absolute contrast enhancement washout of 60% or higher has a sensitivity of 86–88% and a specificity of 92–96% for the diagnosis of an adenoma • (VA - DA) / (VA - PCA) × 100 VA = venous attenuation, DA = delayed attenuation, and PCA = precontrast attenuation.
%RCEW (Relative Contrast Enhancement Washout) • Frequently, in clinical practice, only post-contrast are available. • In these patients, by performing a delayed 15-min CT the percentage relative contrast enhancement washout can be calculated thus: • (VA - DA) / VA × 100 • After 15 min, if a relative enhancement washout of 40% or higher is achieved, this has a sensitivity of 96% and a specificity of 100% for the diagnosis of an adenoma.
In summary • Most lesions can be fully characterized by CT alone and require no further confirmatory imaging. • If an adrenal mass measures 0 HU or less, the lesion is definitely benign. • Lesions on unenhanced CT with an attenuation greater than 10 HU require further evaluation with either contrast-enhanced washout CT, MRI or scintigraphy.
Guidelines published by the American College of Radiology suggest that for lesions >4 cm in size, adrenal resection without any other additional imaging work-up should be considered once • biochemical evaluation to exclude phaeochromocytomas has been performed • if typical imaging features such as those seen in benign lesions such as myelolipomas, adenomas, cysts are not present.
The same guidelines also controversially suggest • In patients with no history of prior malignancy who present with a <4 cm adrenal mass • with benign imaging features such as smooth external contour and homogeneous appearance, a follow-up in 6–12 months is adequate and no additional imaging with contrast enhancement or chemical shift imaging (CSI) MRI is required. • In the authors’ experience, other confirmative features of a benign lesion are needed before this guideline can be safely applied.