Download
1 / 9
90 likes | 180 Views
Grade Inflation, Reality or Artifact of Changes in Student Quality or Major Distribution? An Analysis of a Decade of UC Grades, High School Grades, Test Scores, and UC Discipline Distribution Paul W. Eykamp, Ph.D. University of California, Office of the President. Overview

E N D
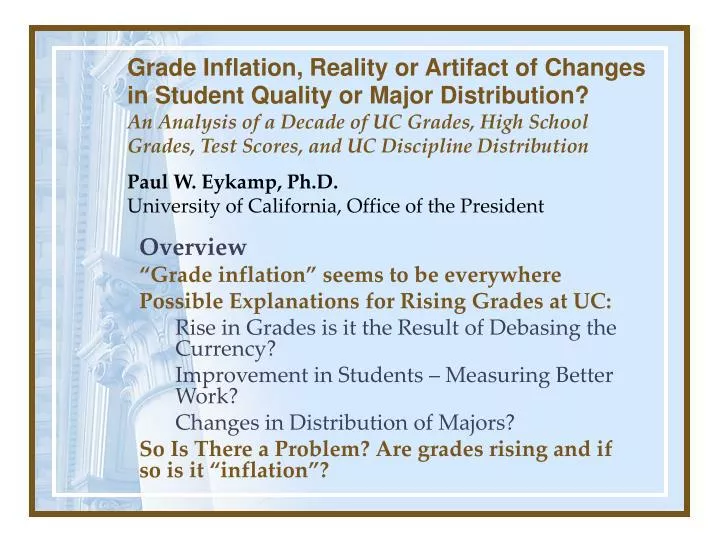
Grade Inflation, Reality or Artifact of Changes in Student Quality or Major Distribution? An Analysis of a Decade of UC Grades, High School Grades, Test Scores, and UC Discipline DistributionPaul W. Eykamp, Ph.D.University of California, Office of the President Overview “Grade inflation” seems to be everywhere Possible Explanations for Rising Grades at UC: Rise in Grades is it the Result of Debasing the Currency? Improvement in Students – Measuring Better Work? Changes in Distribution of Majors? So Is There a Problem? Are grades rising and if so is it “inflation”?
Grade Inflation – Data Mining • What can the data tell us about the existence of grade “inflation”? • How can we separate other potential causes of rising grades from debasement of the currency • Other possible reasons: • Students got “better” and are doing better work. • The distribution of majors changed, and different majors have different grading distributions. • Mining data without advanced statistics
Preparing and Analyzing Data • UC has student records going back to 1989 for ~420,000 students. • Variables have to be properly formatted, bad data removed, SAT scores adjusted for re-centering, students tracked during their career. • Statistical Tools: • Simple Time Series Comparison • Regression • Cluster Analysis • Tree Analysis
Modeling HS GPA Starting Simply Sometimes the question does not require advanced statistics. For instance an important question might just be did something change significantly over time and if so, why? Time Series - Student quality input changes over time compared to final grades. SAT II UC GPA Y4 UC GPA Y1 SAT I Average Grades and SAT Changes 1989 – 2000 HS GPA + 5.3% UC GPA Y1 + 1.1% SAT I + 2.6% UC GPA Y4 + 2.9% SAT II +10.1%
Modeling II • RegressionModel: UC GPA Yr 4 = Year Entered R2 = 0.006 Model: UC GPA Yr 4 = Year Entered HSGPA Discipline SATI & II R2 = 0.2725 (Discipline and some years statistically significant + SAT&GPA). • Tree Analysis – hunting for other causes • Results by Year Entered, Discipline, SAT I, SAT II, and HS GPA (for UC GPA Y4) – table 1 • Results by Year Entered and Discipline (for UC GPA Y4) table 2 Table 1 Table 2
Table 1 Table 2 Modeling III • Cluster Analysis • By Discipline (table 1) • By Year (table 2) • Simple Statistics Disciplines with greater than average Enrollment Growth with Discipline GPA • Social Sci. 3.07 • Psychology 3.08 • Interdiscipl. 3.10 • Business 3.07 • Engineering 3.00 • Fine Arts 3.21 • Mean GPA whole period 3.05 • Higher growth disciplines tended to have higher GPAs. Table 3 FA Inter-dis Soc Sci BIO Table 3
Findings • Some (probably unexpected) results • High School Grades and SAT II changes have far greater predictive influence than Year Entered (both by Regression and Tree analysis). • Students got a little better, at least as measured by their SAT I and II scores by about 2.6 and 10% and High School GPAs by 5.4% • UC GPA increase is small and noisy ~2-3% over a decade depending heavily on start and stop year. • Shifts in discipline seem less important but tree diagram analysis indicates that there are shifts in discipline distribution that may influence the average. • For some data and some questions, trying to mine using advanced statistics leads to more headaches than knowledge. • Mining is only as good as the ore.
Things We Can’t Be Sure of • SAT not perfect measure of Student Achievement – What is the SAT – High School Grade relationship • Role of HS Grade Rise – Has there been inflation, or is our pool of students better (and how to adjust for Honors and AP courses over time which have also gone up). • Change in expectations over time • Missing, bad, data, inconsistent definitions in longitudinal data. Two different databases and variance in campus reporting.
Applications • Illustrates how Data Mining Can Answer Questions About the Existence or Extent of a Longitudinal Problem beyond simple reporting. • How to Tease Out Trends in Sub-Populations. • Provide Environmental Scans – do widely perceived problems actually exist? • Possible to do Data Mining even if you do not use advanced statistics.