Download
1 / 32
320 likes | 470 Views
TC Intensity Estimation: SATellite CONsensus (SATCON). University of Wisconsin - Madison Cooperative Institute for Meteorological Satellite Studies. Jeff Hawkins. Derrick Herndon, Chris Velden, Tony Wimmers, Tim Olander. Naval Research Laboratory Monterey, CA.

E N D
TC Intensity Estimation: SATellite CONsensus (SATCON) University of Wisconsin - Madison Cooperative Institute for Meteorological Satellite Studies Jeff Hawkins Derrick Herndon, Chris Velden, Tony Wimmers, Tim Olander Naval Research Laboratory Monterey, CA International Workshop on Tropical Cyclone Analysis and Intensity Honolulu, HI 13-16 April 2011 The support of the research sponsors, the Oceanographer of the Navy through the program office at the PEO C4I&Space/PMW-120, under program element PE-0603207N and the Office of Naval Research under program element PE-0602435N is gratefully acknowledged.
Motivation • Contemporary methods to estimate TC intensity can vary by more than 40 knots • Several objective TC intensity methods exist, but the goal of SATCON is to assess the current intensity by combining the confident aspects of the individual objective estimates into a single “best” estimate
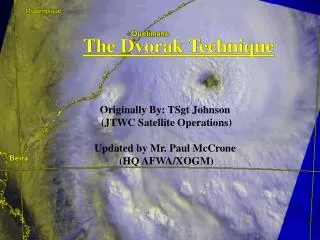
TCS-08 result showing the spread of 5 expert Dvorak analysts for TY Sinlaku (15W) who were blind to recon obs
Even taking an average of five expert Dvorak intensity estimates can lead to significant differences.
Clear Eye Pinhole Eye Large Eye Uniform Curved Band Shear SATCON Members • ADT (Advanced Dvorak Technique) • Uses IR imagery to objectively assess storm cloud patterns and structure to infer intensity • Latest version uses information from MW to make adjustments
TC Pressure Anomaly Magnitude AMSU Channel 8 Tb Anomaly Magnitude SATCON Members: CIMSS AMSU Channel 8 150 mb Channel 7 250 mb 55 Knots 350 mb Channel 6 AMSU Tb Anomaly vertical cross section for Katrina 2005 70 Knots 125 knots
SATCON Members: CIRA AMSU Similar to CIMSS approach, however the AMSU-A Tb are used to retrieve a temperature profile at 23 pressure levels. Estimates of Vmax are then determined from the thermal warm core structure and non-linear balance equation. IR image from NRL TC Page
SATCON Strategy The strengths and weaknesses of each objective method are assessed based on statistical analysis, and that knowledge is used to assign weights to each method in the consensus algorithm based on situational performance to arrive at a single superior intensity estimate
Another important component of SATCON is cross-method information sharing • Utilize relationships that exist between the output parameters of the individual member algorithms • Unique information from each of these parameters can be shared between the algorithms to improve the performance of the individual members • Situational corrections can be made to each algorithm’s intensity output, then the member weights re-derived to produce an improved consensus estimate
SATCON cross-method information sharing Example: ADT to CIMSS AMSU ADT Estimate of Eye Size In clear eye scenes, IR can be used to estimate eye size CIMSS AMSU uses eye size information to correct resolution sub-sampling Compare to AMSU-A FOV resolution Adjust AMSU pressure if needed
SATCON cross-method information sharing Example: Objective estimates of eye size from CIMSS ‘ARCHER’ method (using MW imagery) Currently, CIMSS AMSU method uses IR-based eye size or values from op center if no eye in IR MW imagery (MI) often depicts eyes when IR/ADT cannot ARCHER method (Wimmers and Velden, 2010) uses objective analysis of MI and accounts for eyewall slope ARCHER eye = 33 km Information can be input to CIMSS AMSU method
SATCON cross-method information sharing CIMSS AMSU position with bracketing correction can be applied to correct CIRA AMSU estimate
SATCON Weighting Scheme • Weights are based on situational analysis for each member • Separate weights for MSW and MSLP estimates • Example criteria: scene type (ADT) scan geometry/sub-sampling (AMSU) Example: ADT Scene type vs. performance SHEAR CDO EYE RMSE 14 knots RMSE 12 knots RMSE 18 knots
SATCON Weighting Scheme Example: AMSU scan geometry vs. performance A B C CIRA RMSE 12 knots CIMSS RMSE 10 knots CIRA RMSE 15 knots CIMSS RMSE 12 knots CIRA RMSE 18 knots CIMSS RMSE 15 knots
Additional SATCON Adjustments • Use ARCHER scores to determine how much motion component to add. A greater component is added to storms with strong well developed eyewalls, and less component for storms with poor inner core structure • Use the statistically superior SATCON MSLP estimate to estimate MSW using TC structure information. Take an average of this P-W derived MSW estimate and the SATCON MSW weighted estimate to get final MSW • ARCHER TC eye size is used to adjust MSW upward for for small eyes and downward for large eyes
SATCON Examples ADT determines scene is an EYE scene CIMSS AMSU: Good near nadir pass. Eye is well-resolved by AMSU resolution CIRA is sub-sampled by FOV offset with TC center B SATCON Weighting: ADT = 28 % CIMSS AMSU =47 % CIRA AMSU = 25 %
SATCON Examples ADT determines situation is a SHEAR scene CIMSS AMSU indicates no sub-sampling present CIRA AMSU: little/no sub-sampling error due to position offset from FOV center Center of TS Chris SATCON Weighting: ADT = 18 % CIMSS AMSU =41 % CIRA AMSU = 41 %
1999-2010 SATCON Performance (Vmax) Cases: ATL = 263 EPAC = 8 WPAC = 18 Independent sample. Values in knots. Validation is Best Track Vmax coincident with aircraft recon +/- 3 hours from estimate time. Negative bias = method was too weak. Important Note: “Dvorak” performance values are derived from a consensus of available estimates (the consensus is usually superior to individual OFC estimates
1999-2010 SATCON Performance (Vmax) WPAC Independent sample. Values in knots. Validation is Best Track Vmax coincident with aircraft recon +/- 3 hours from estimate time. Negative bias = method was too weak. Important Note: “Dvorak” performance values are derived from a consensus of available estimates (the consensus is usually superior to individual OFC estimates
1999-2010 SATCON Performance (MSLP) Cases: ALT = 263 EPAC = 8 WPAC = 18 Independent sample. Values in millibars. Validation is coincident with aircraft recon +/- 3 hours from estimate time. Negative bias = method was too weak. Important Note: “Dvorak” performance values are derived from a consensus of available estimates (the consensus is usually superior to individual OFC estimates
1999-2010 SATCON PerformanceComparison to simple ave/consensus (un-weighted) Cases: ALT = 263 EPAC = 8 WPAC = 18 Independent sample. Validation is coincident with aircraft recon +/- 3 hours from estimate time. Negative bias = method was too weak.
SATCON Web Site http://cimss.ssec.wisc.edu/tropic2/real-time/satcon
References Brueske K. and C. Velden 2003: Satellite-Based Tropical Cyclone Intensity Estimation Using the NOAA-KLM Series Advanced Microwave Sounding Unit (AMSU). Monthly Weather Review Volume 131, Issue 4 (April 2003) pp. 687–697 Demuth J. and M. DeMaria, 2004: Evaluation of Advanced Microwave Sounding Unit Tropical-Cyclone Intensity and Size Estimation Algorithms. Journal of Applied Meteorology Volume 43, Issue 2 (February 2004) pp. 282–296 Herndon D. and C. Velden, 2004: Upgrades to the UW-CIMSS AMSU-based TC intensity algorithm. Preprints, 26th Conference on Hurricanes and Tropical Meteorology, Miami, FL, Amer. Meteor. Soc., 118-119 Olander T. and C. Velden 2007: The Advanced Dvorak Technique: Continued Development of an Objective Scheme to Estimate Tropical Cyclone Intensity Using Geostationary Infrared Satellite Imagery. Wea. and Forecasting Volume 22, Issue 2 (April 2007) pp. 287–298 Velden C. et al., 2006: The Dvorak Tropical Cyclone Intensity Estimation Technique: A Satellite-Based Method that Has Endured for over 30 Years. Bulletin of the American Meteorological Society Volume 87, Issue 9 (September 2006) pp. 1195–1210 Wimmers, A., and C. Velden, 2010: Objectively Determining the Rotational Center of Tropical Cyclones in Passive Microwave Satellite Imagery. Submitted to JAMC.
Analysis of Sat-Based TC Intensity Estimation in the WNP During TCS-08 Comparison of All Satellite-based Estimates – Vmax (Kts) Positive Bias indicates method estimates are too strong
Analysis of Sat-Based TC Intensity Estimation in the WNP During TCS-08 Comparison of All Satellite-based Estimates – MSLP (mb) Positive Bias indicates method estimates are too strong. 2mem SATCON RMSE= 4.7 Blind and Oper Dvorak conversion is Knaff/Zehr